EDC Health Monitor
Version 0.7.8
The EDC Health Monitor is a web-based dashboard that provides real-time monitoring and management of your Portable Edge Data Center (EDC). It runs locally on the EDC's integrated single-board computer (SBC) and gives you at-a-glance visibility into your HCI cluster, network devices, UPS/battery status, and network health — all from a single interface.
Key Features
- HCI Cluster Monitoring — Real-time CPU, memory, and storage metrics for your Scale Computing or Proxmox cluster, with per-node status and VM tracking
- Network Device Management — Monitor your EnGenius network switch port status and smart PDU outlet status via the EnGenius Cloud API
- UPS / Battery Monitoring — Track battery charge, voltage, runtime, and load through Network UPS Tools (NUT), with automatic HCI cluster shutdown on low battery
- Network Diagnostics — Built-in tools including speed tests, ping, traceroute, network scanning, DNS lookup, and more
- System Management — Time settings, system updates, user management, and full audit logging
Accessing the Dashboard
The dashboard is accessible from any device on the same local network as your EDC.
URL
Navigate to one of the following in your web browser:
- By IP address:
https://<edc-ip-address>(your administrator will provide this) - By hostname:
https://hiveradar-edc.local(uses mDNS — requires Bonjour/Avahi on your client device)
The dashboard uses HTTPS with a self-signed certificate by default. Your browser will show a security warning on first visit. This is expected — accept the certificate to proceed.
Logging In
- Enter your Username and Password on the login page
- Click Sign In
If you don't have an account, contact your administrator.
Default credentials for new deployments: admin / admin
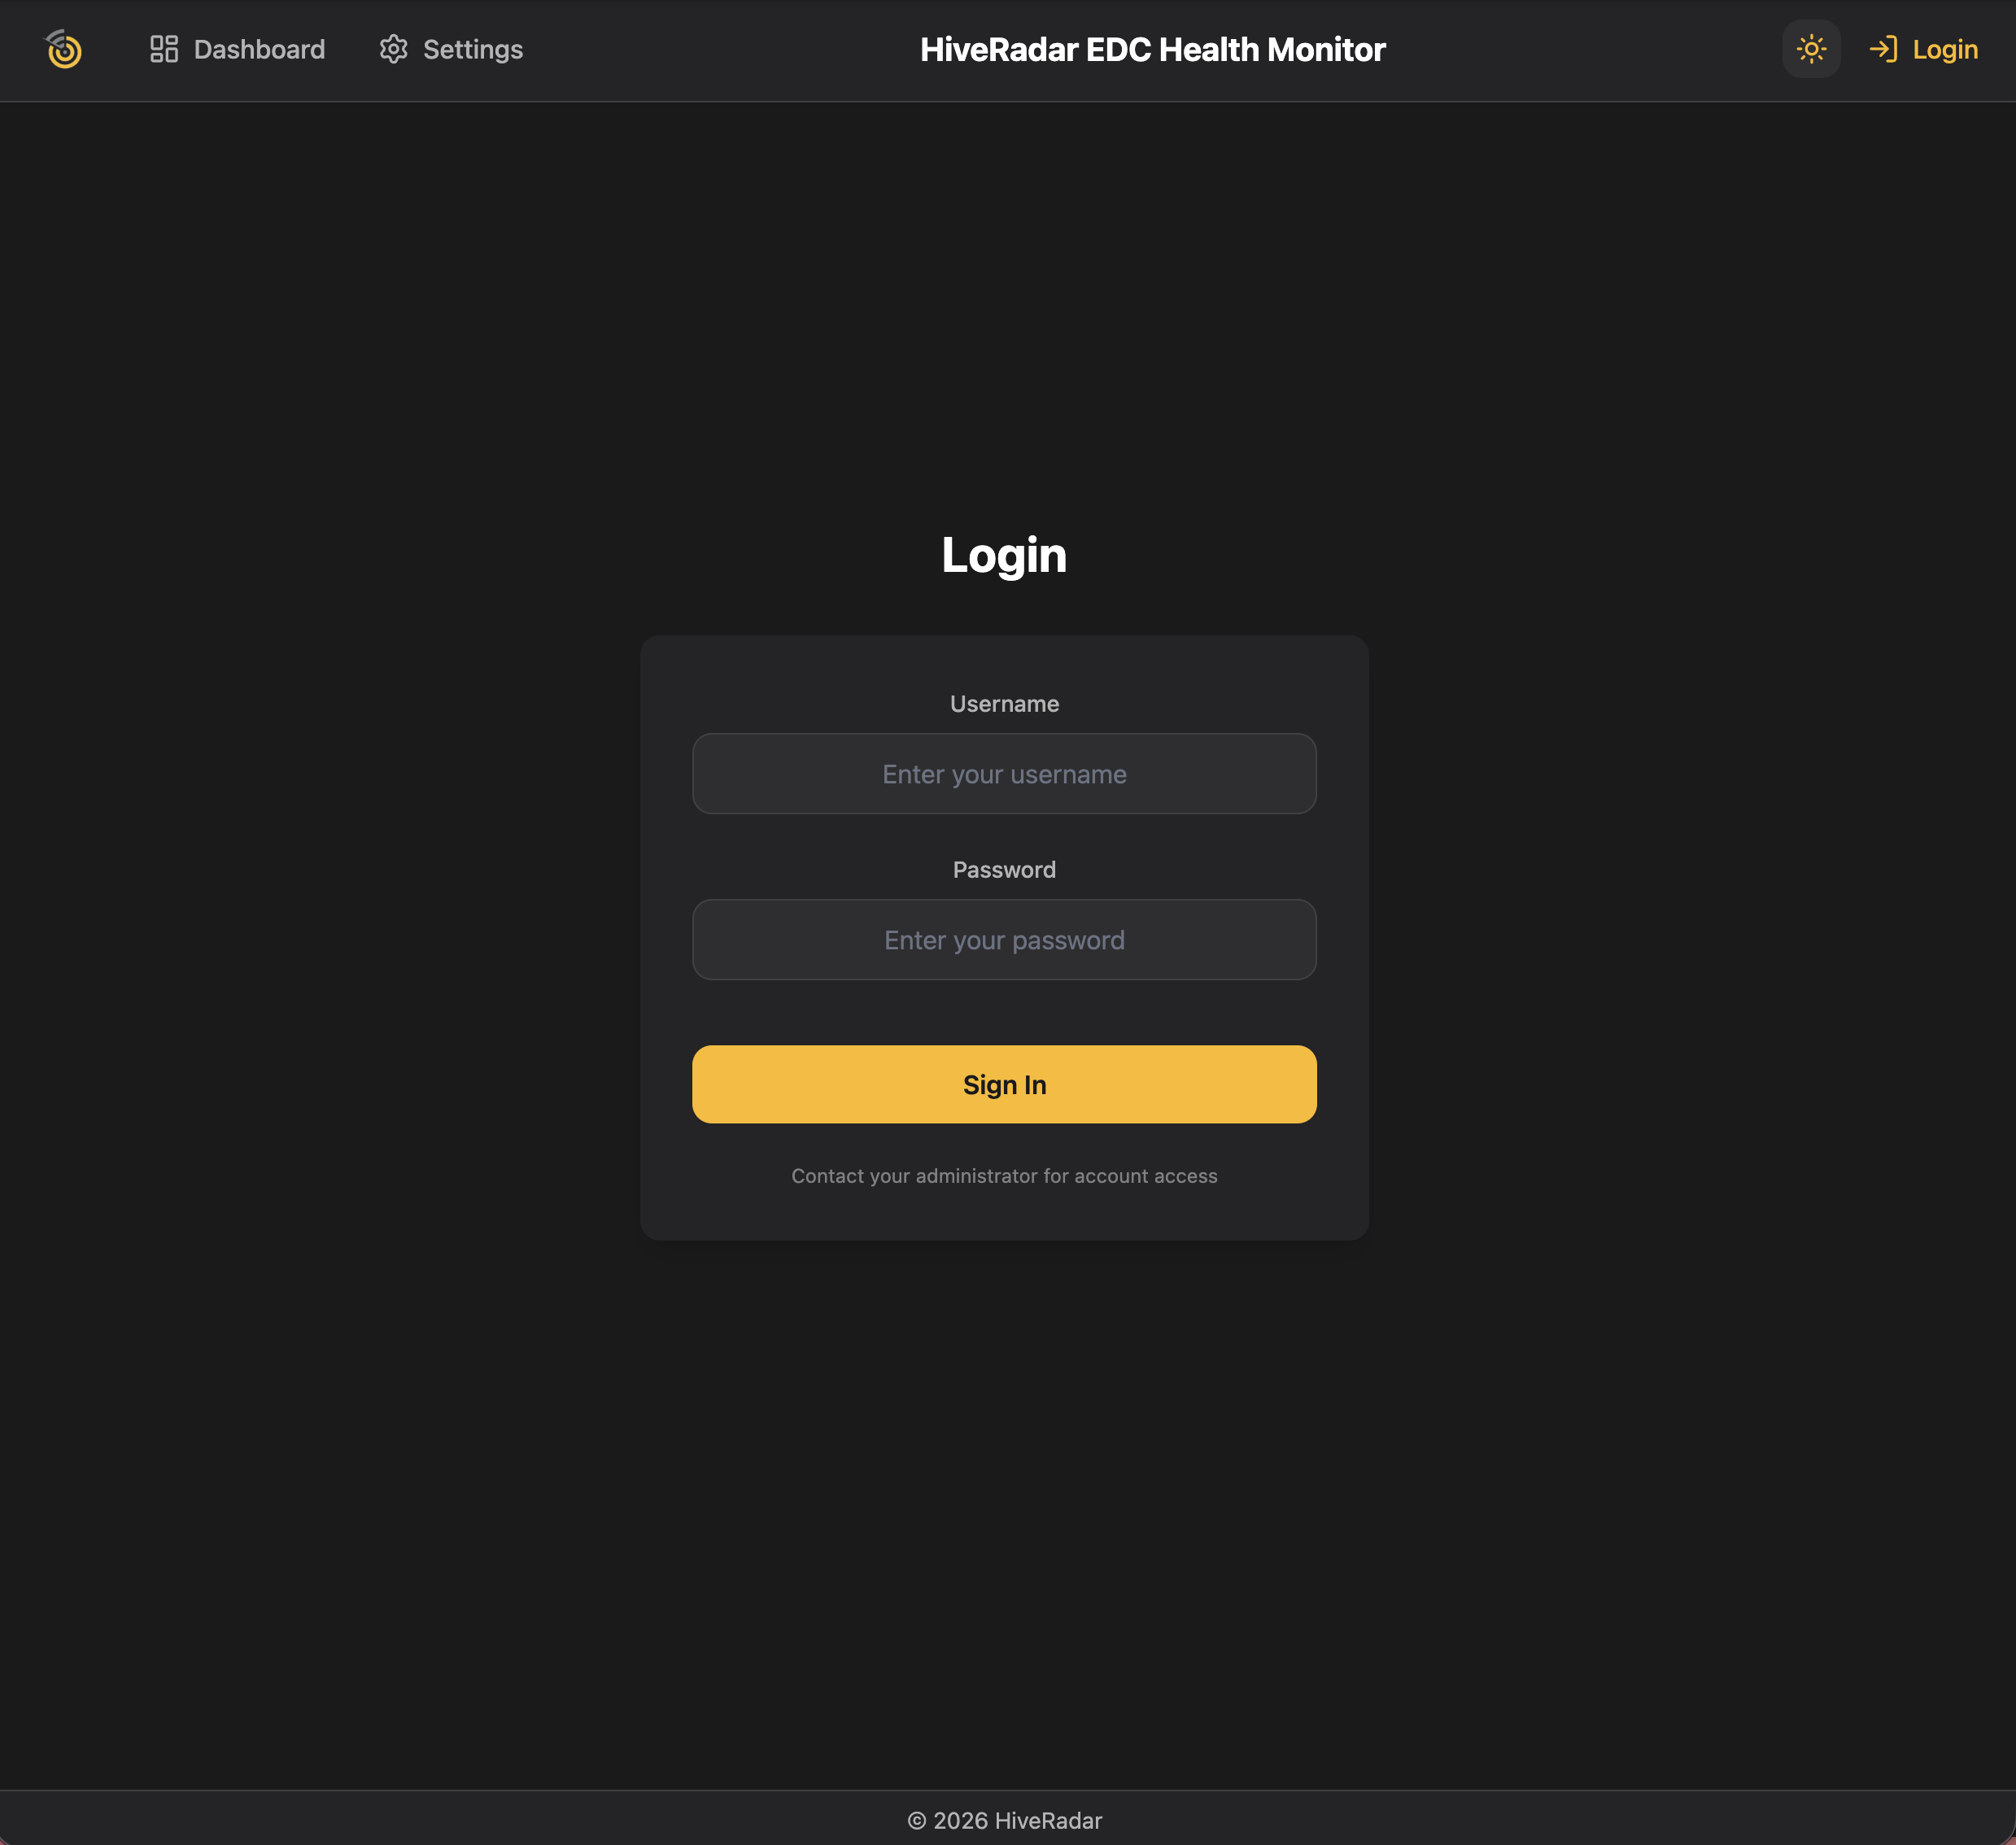
[Screenshot: Login page]
Changing Your Password on First Login
When logging in for the first time, you'll be prompted to change your password before accessing the dashboard:
- Enter your Current Password (the one provided by your administrator)
- Choose a New Password (minimum 8 characters)
- Confirm New Password by entering it again
- Click Change Password
You'll be redirected to the dashboard after a successful change.
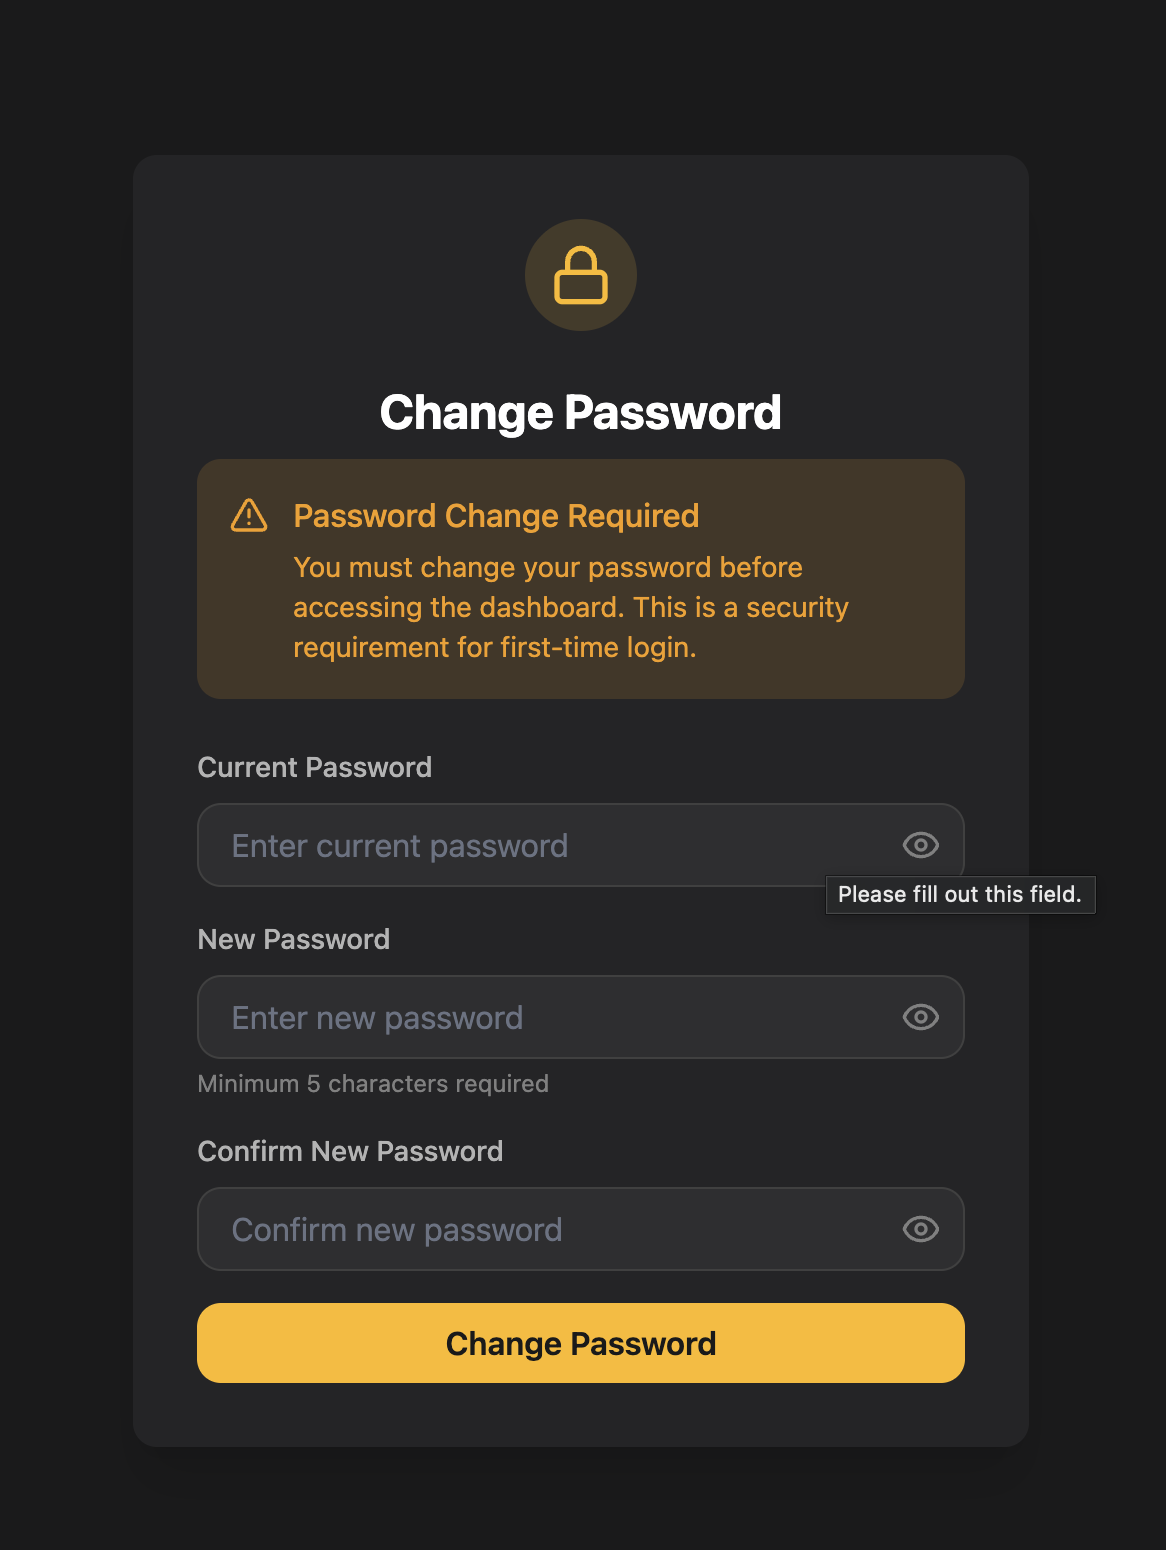
[Screenshot: Change password page]
Setup Wizard
If this is a new deployment, the setup wizard walks you through initial configuration. It appears automatically on first login if setup hasn't been completed. You can also re-run it at any time from the Settings page.
Step 1: Welcome
The welcome screen gives an overview of what you'll configure — HCI cluster monitoring and network device monitoring. You have two options:
- Click Get Started to begin the wizard
- Click Skip Setup to configure later from Settings
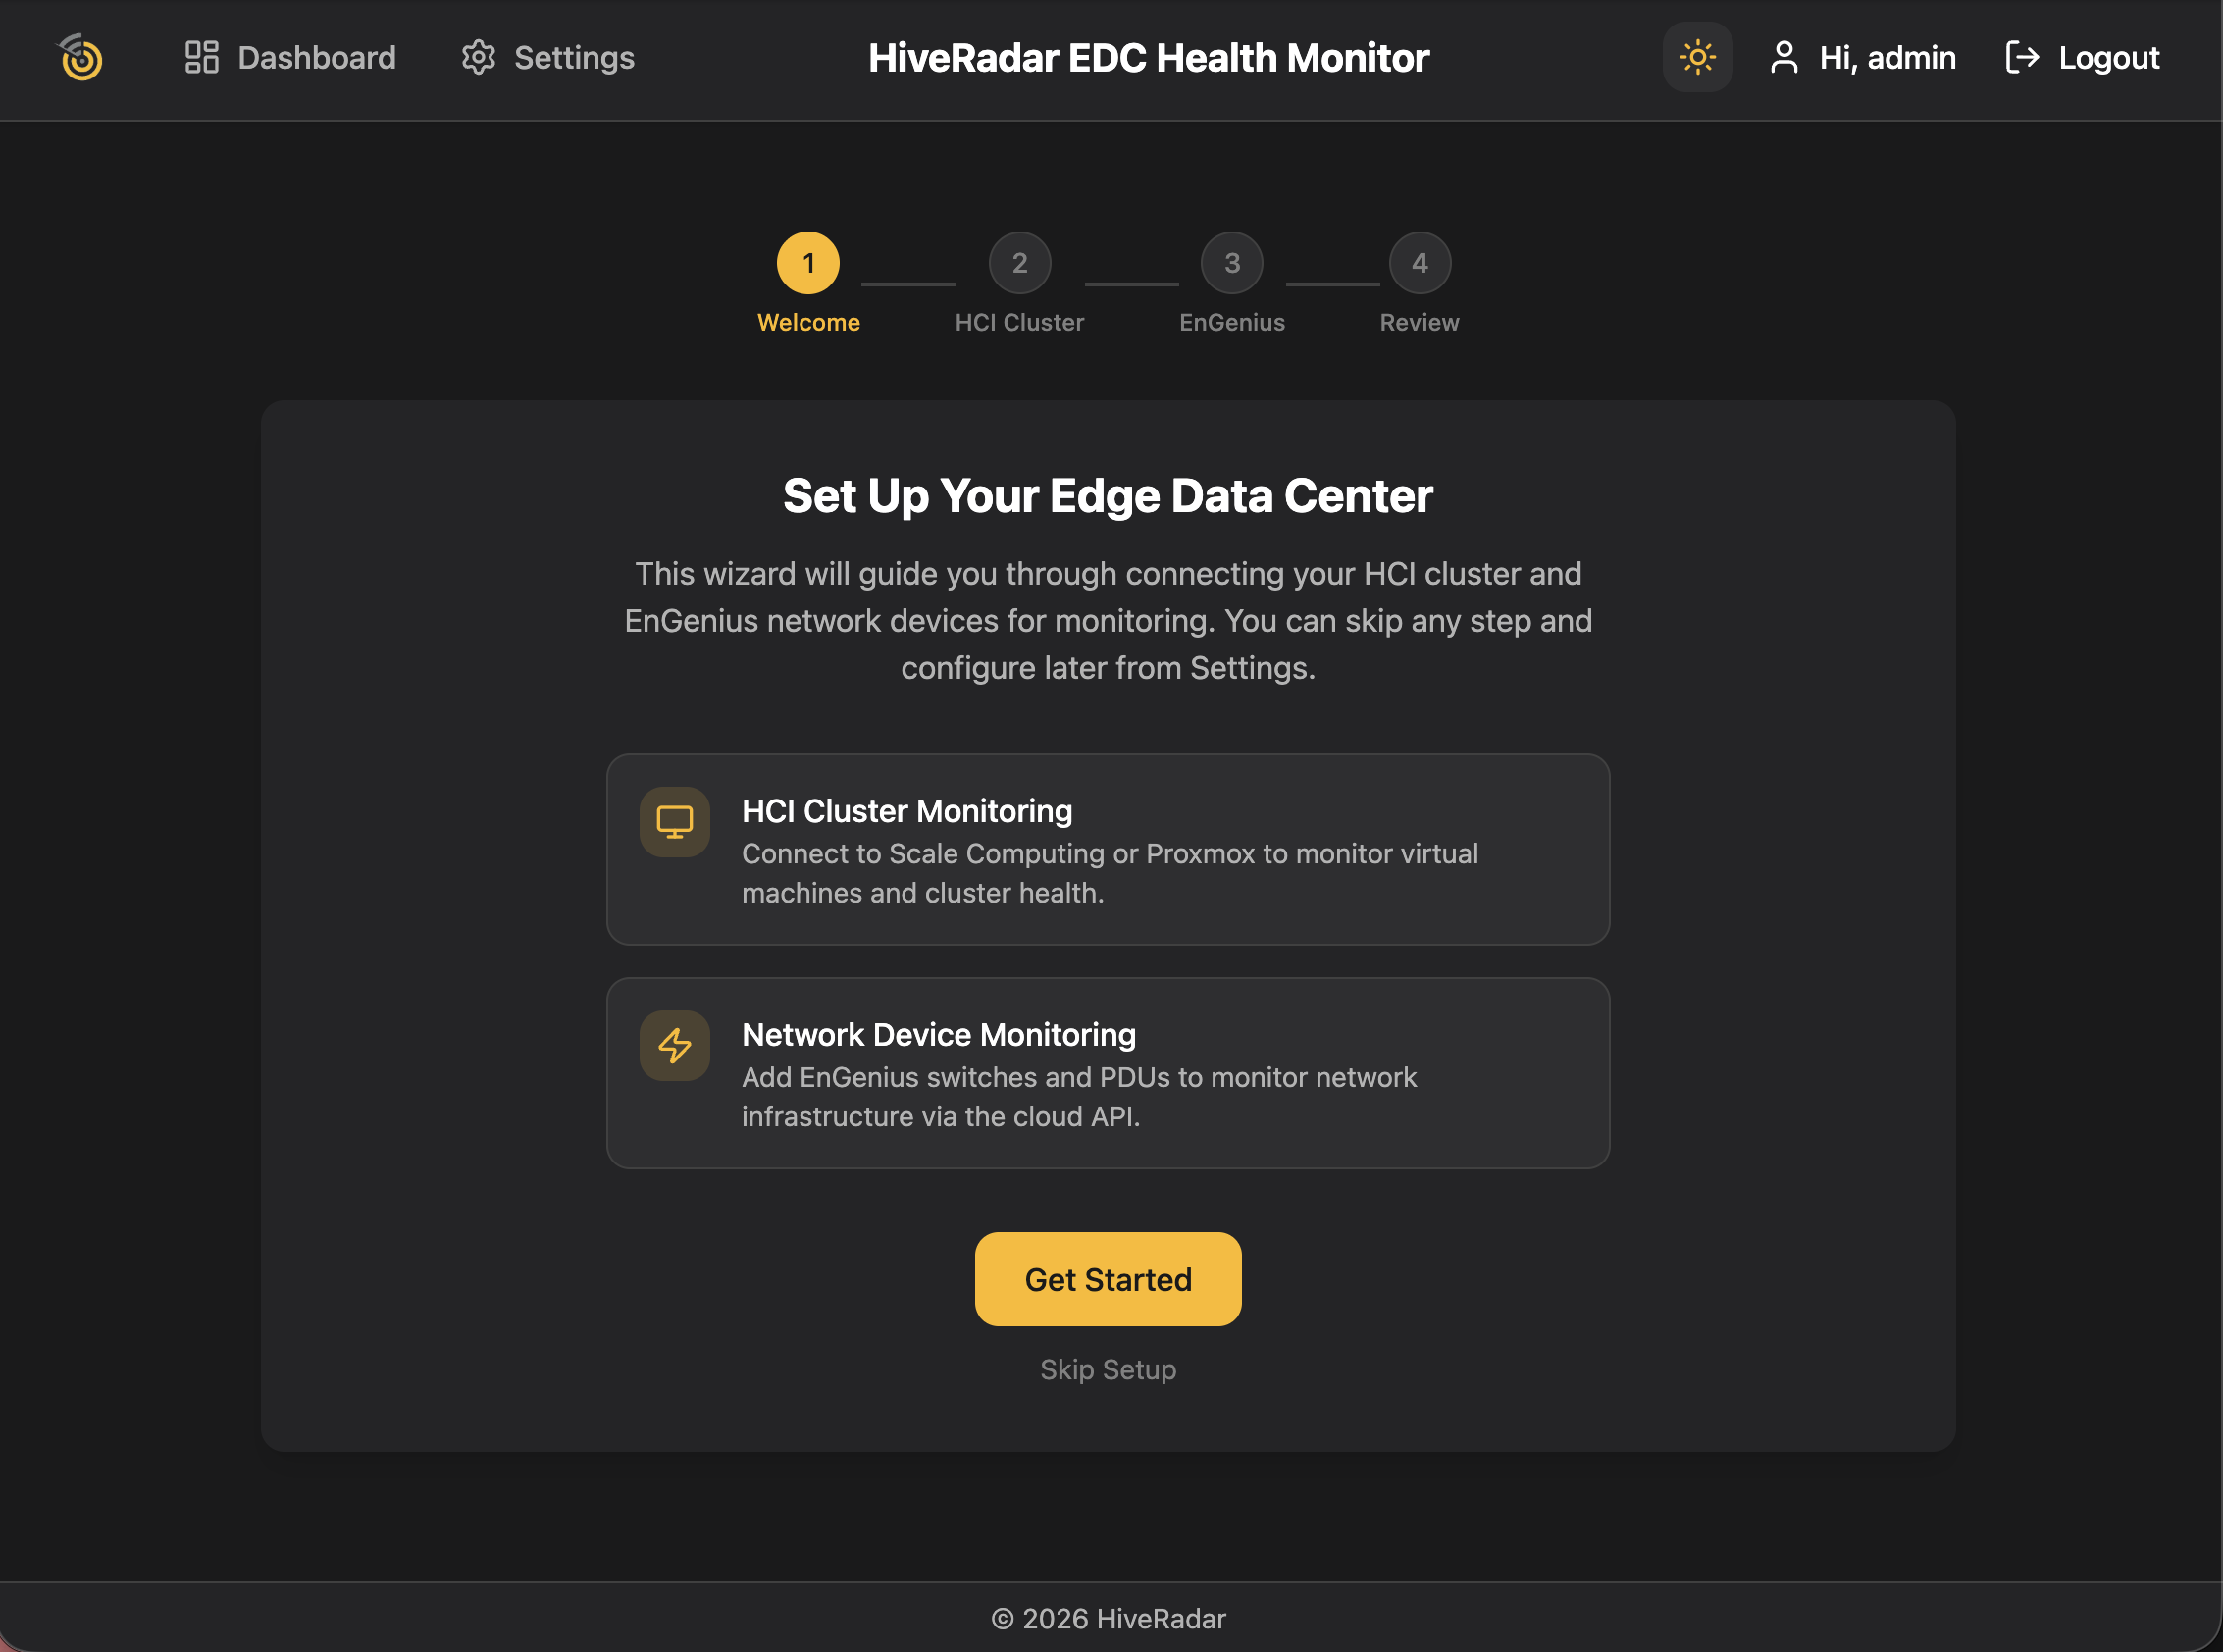
[Screenshot: Setup wizard — Welcome step]
Step 2: HCI Cluster
Connect to your hyperconverged infrastructure cluster. Fill in the following fields:
| Field | Description |
|---|---|
| Connection Name | A friendly name for this cluster (e.g., "Primary Cluster") |
| HCI Vendor | Select your vendor: Scale Computing HyperCore or Proxmox VE |
| IP Address / Hostname | The cluster's management IP or hostname |
| Port | Management port (auto-populated: 443 for Scale, 8006 for Proxmox) |
| Protocol | HTTPS (recommended) or HTTP |
| Username | Cluster admin username |
| Password | Cluster admin password |
| Verify SSL | Whether to verify the cluster's SSL certificate |
| Enabled | Toggle polling on or off |
To test and save your connection:
- Fill in all fields
- Click Test Connection — the system will attempt to connect and report success or failure
- If the test passes, click Save Connection
You can add multiple cluster connections if needed. Click Skip to configure this later.
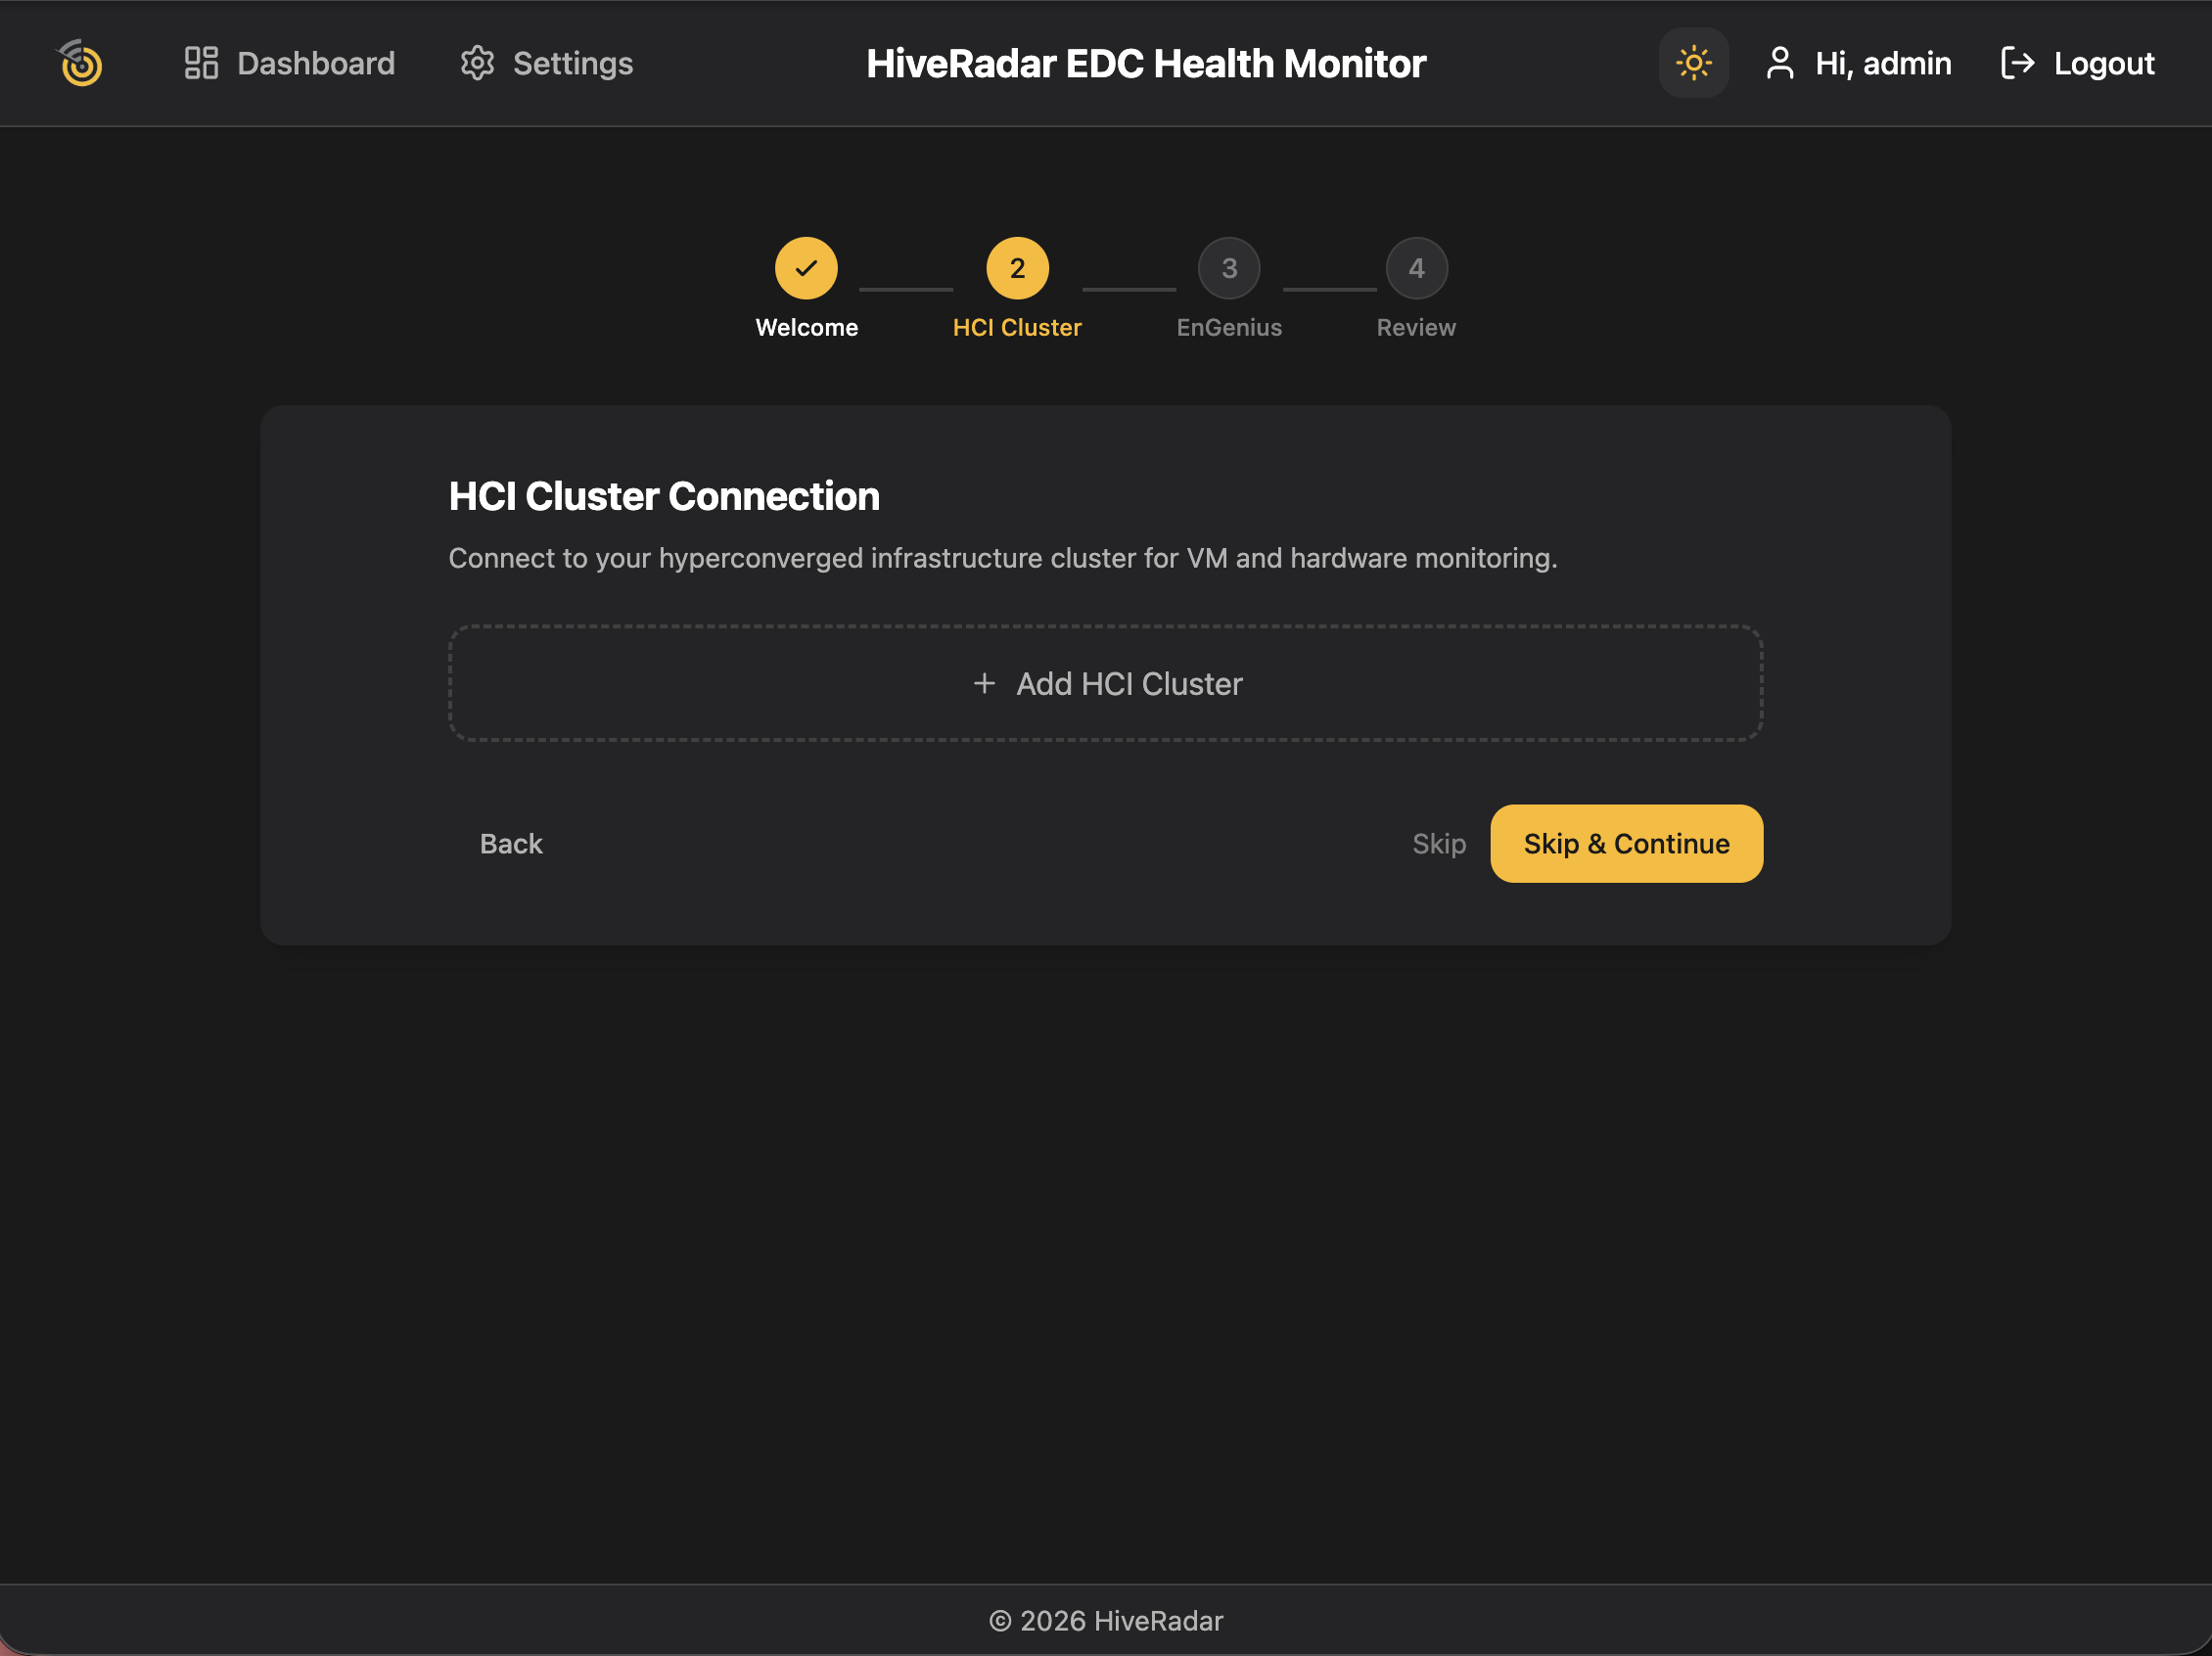
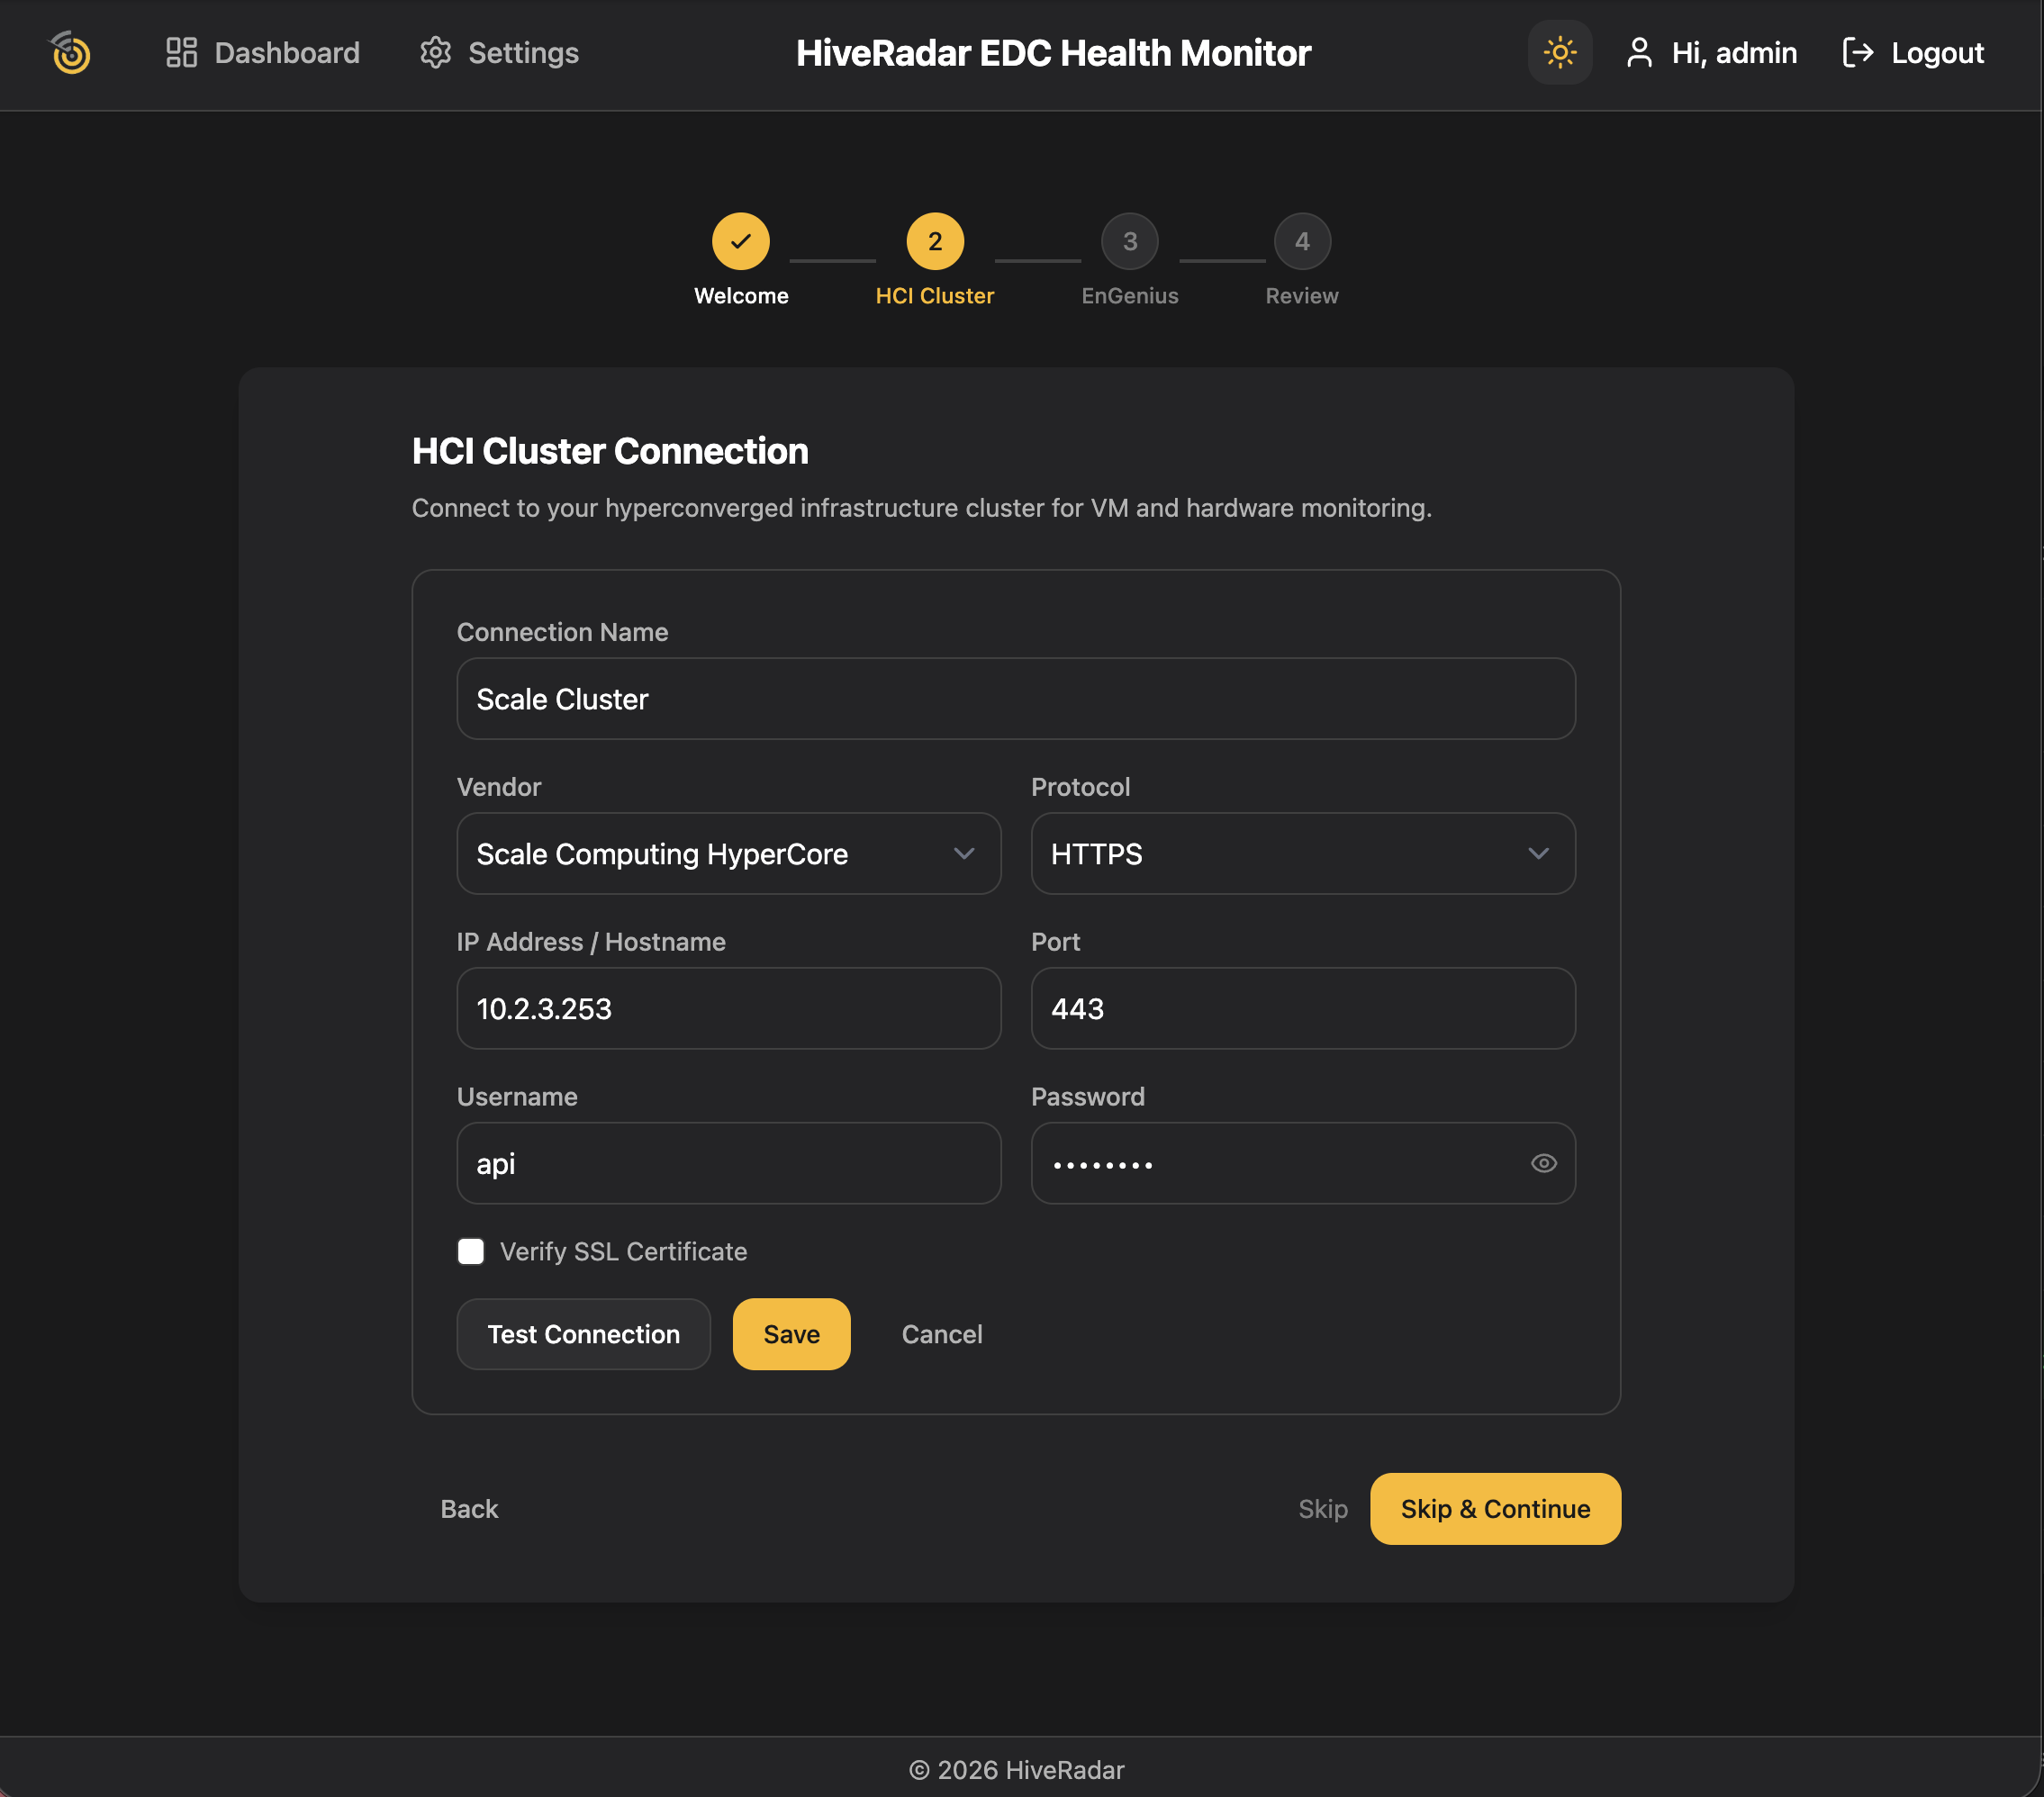
[Screenshot: Setup wizard — HCI Cluster steps]
Step 3: EnGenius Devices
Add your EnGenius Cloud-managed network switch and smart PDU for monitoring.
| Field | Description |
|---|---|
| Device Name | A friendly name for this device (e.g., "EDC Switch") |
| Device Type | Switch or PDU |
| Serial Number | Device serial number from EnGenius Cloud |
| API Key | Your EnGenius Cloud API key |
| Organization ID | EnGenius Cloud organization ID |
| HV ID | EnGenius Cloud HV ID |
| Network ID | EnGenius Cloud network ID (optional) |
To set up a device:
- Enter the device name, type, serial number, and API key
- Click Auto-Discover Organization Details — this automatically populates the Organization ID and HV ID from your API key
- Click Test Connection to verify connectivity
- Click Save Connection
Repeat for each device (typically one switch and one PDU). Click Skip to configure this later.
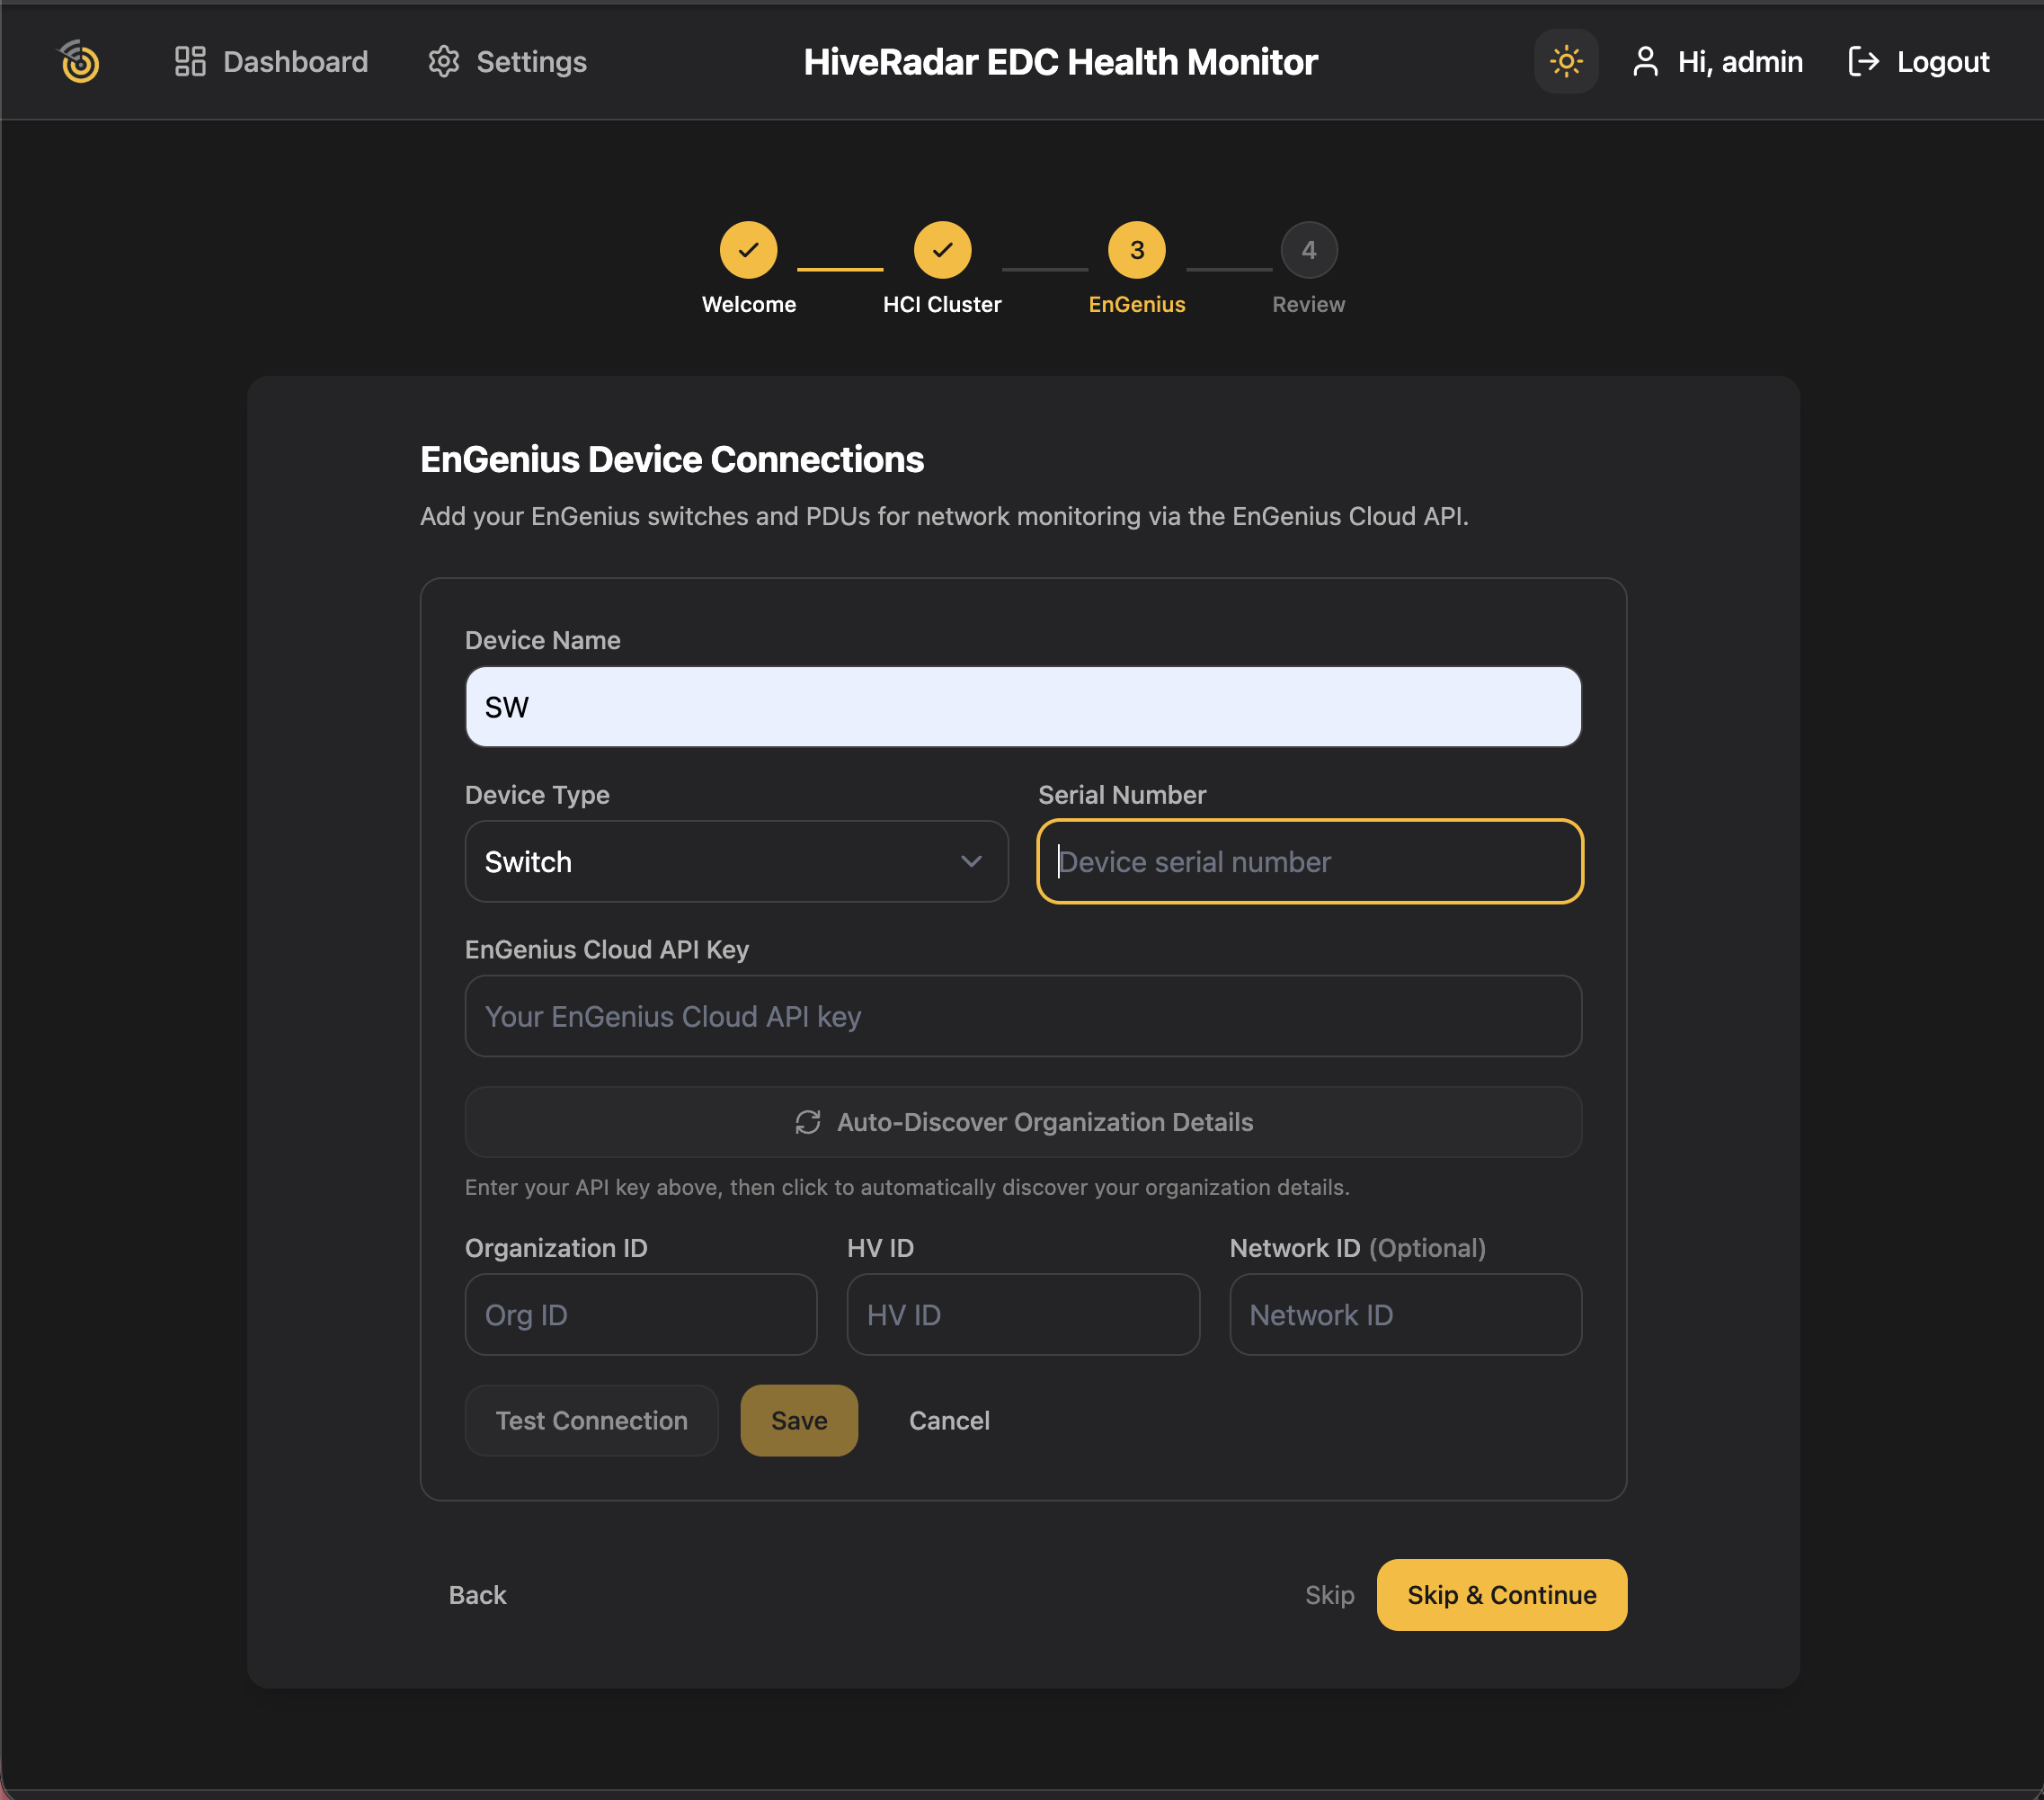
[Screenshot: Setup wizard — EnGenius step with auto-discover]
Step 4: Review
A summary of everything you've configured. Review your connections, then click Go to Dashboard to finish setup.
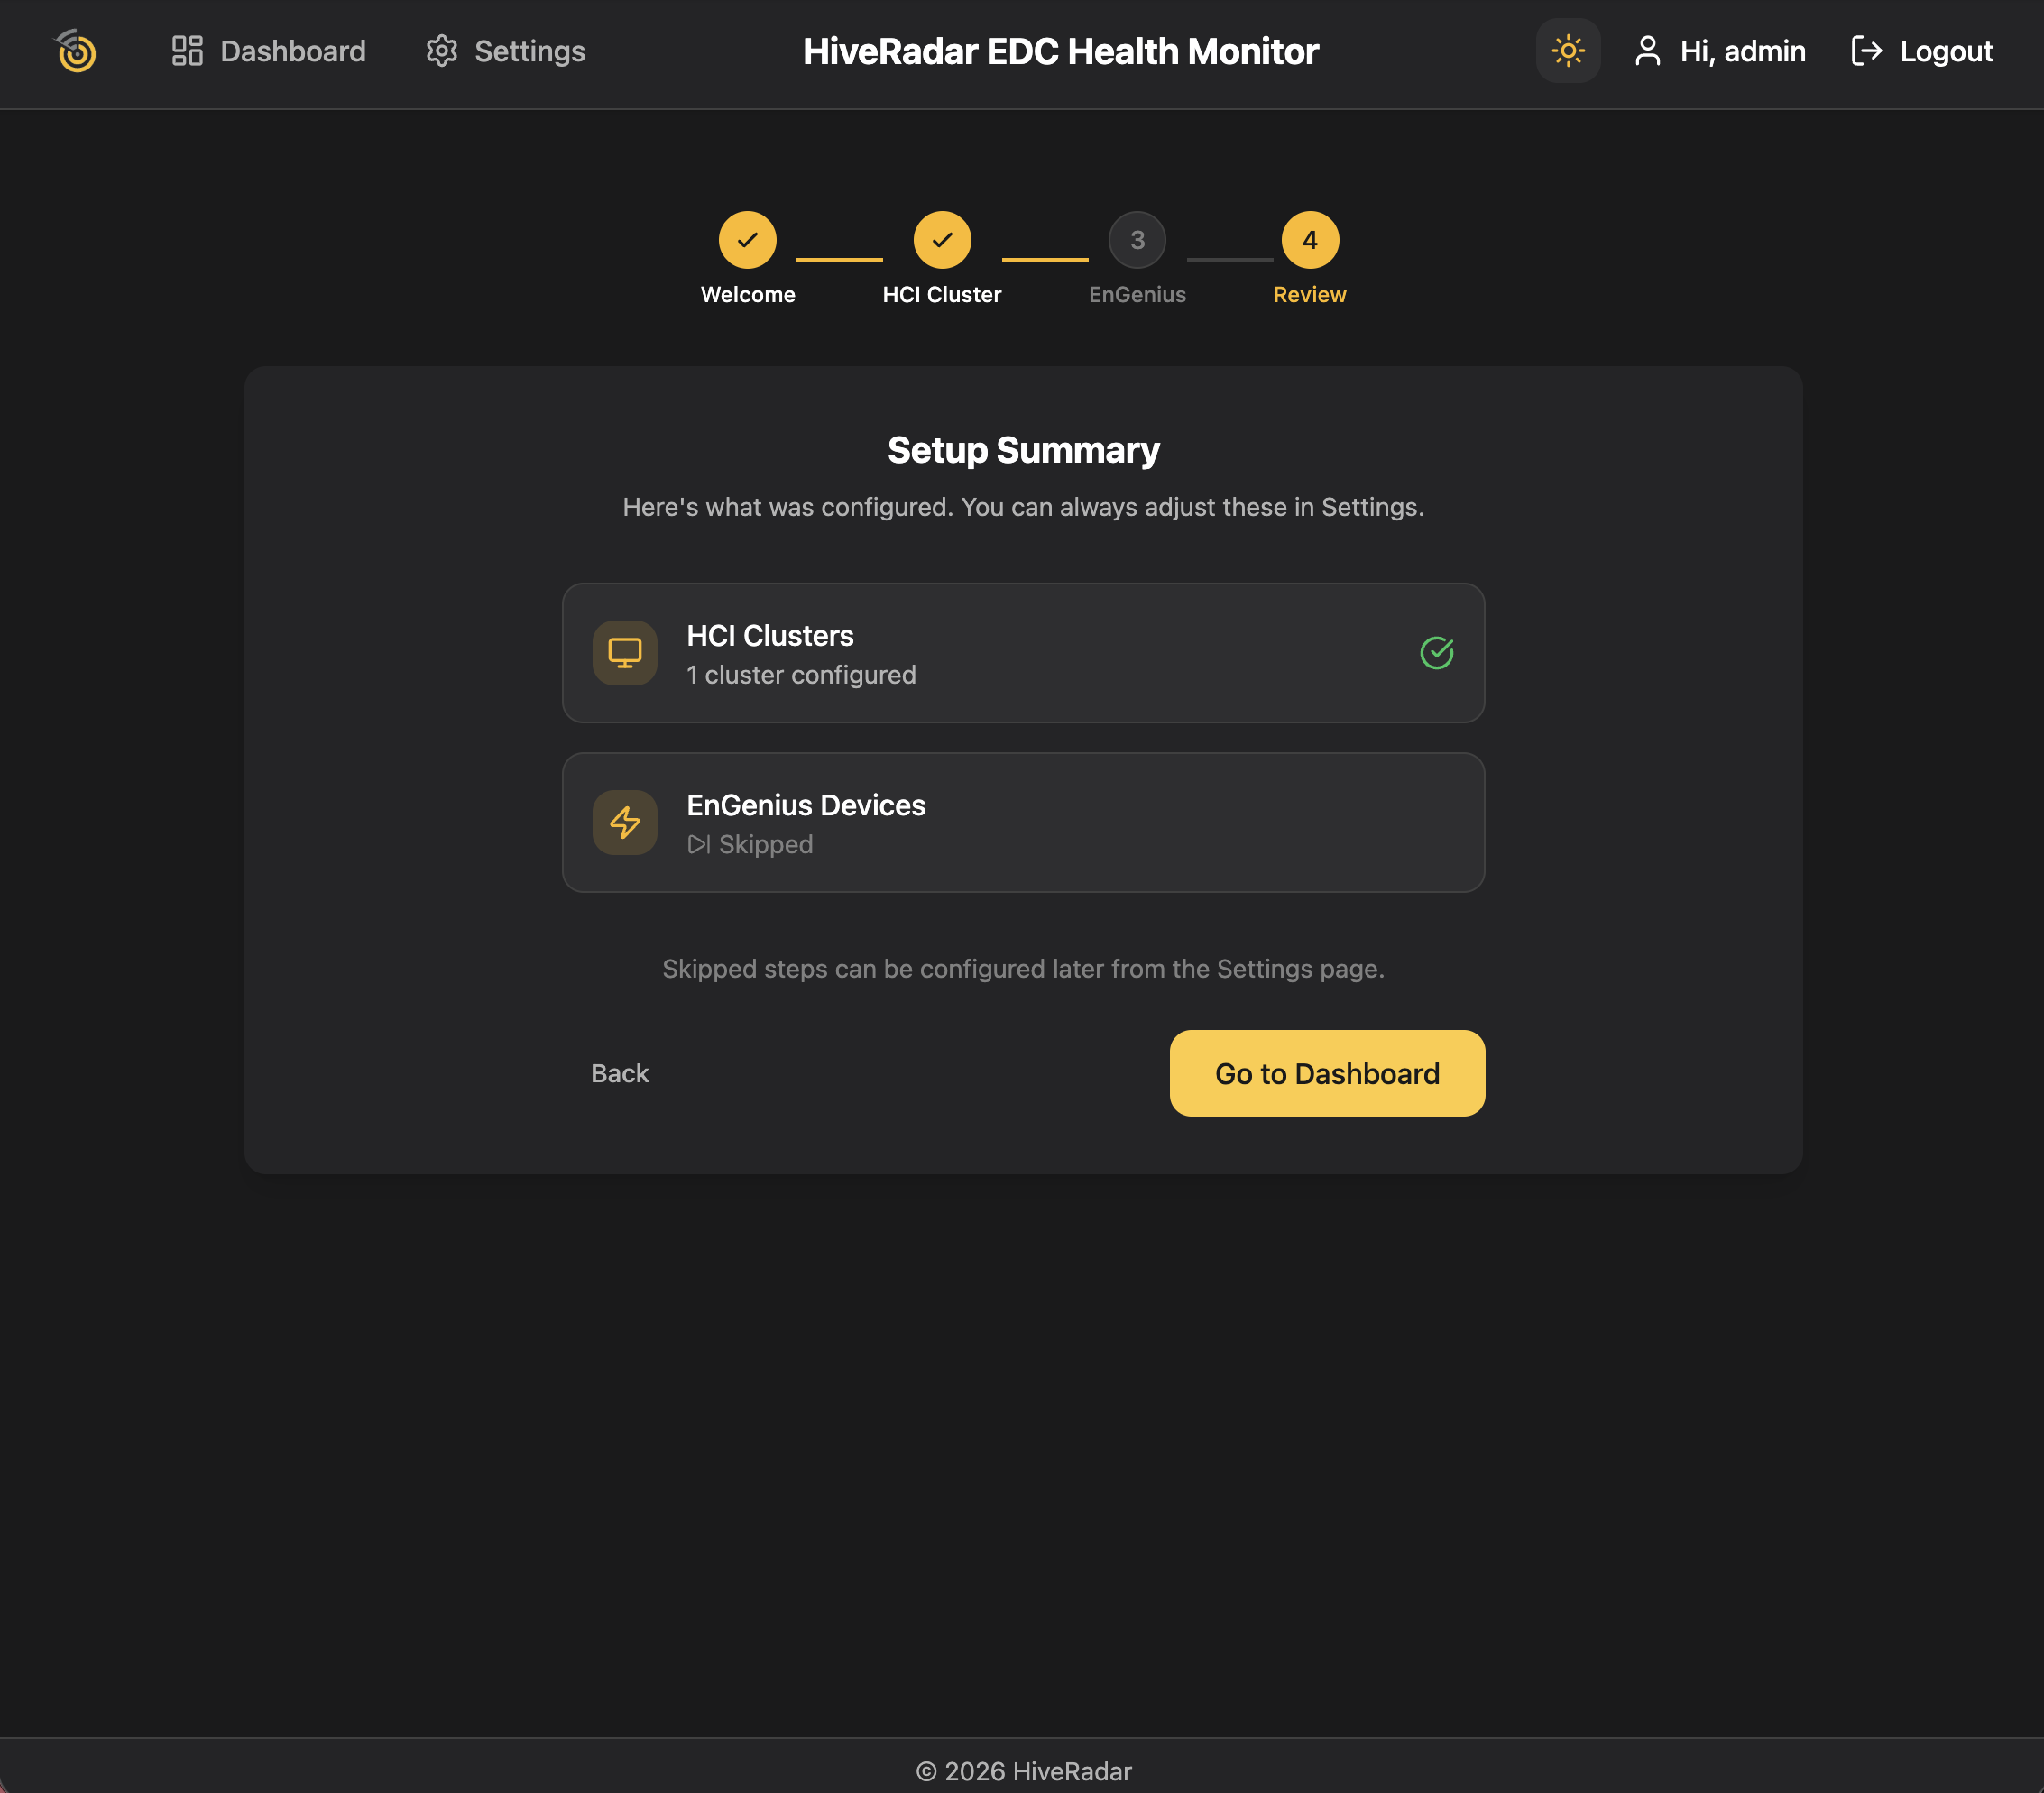
[Screenshot: Setup wizard — Review step]
Dashboard Overview
The main dashboard displays four cards providing an at-a-glance view of your entire EDC. The layout adapts to your screen size — desktop shows a multi-column grid, mobile shows a swipeable carousel, and ultrawide displays (such as dedicated monitoring screens) use a compact horizontal layout.
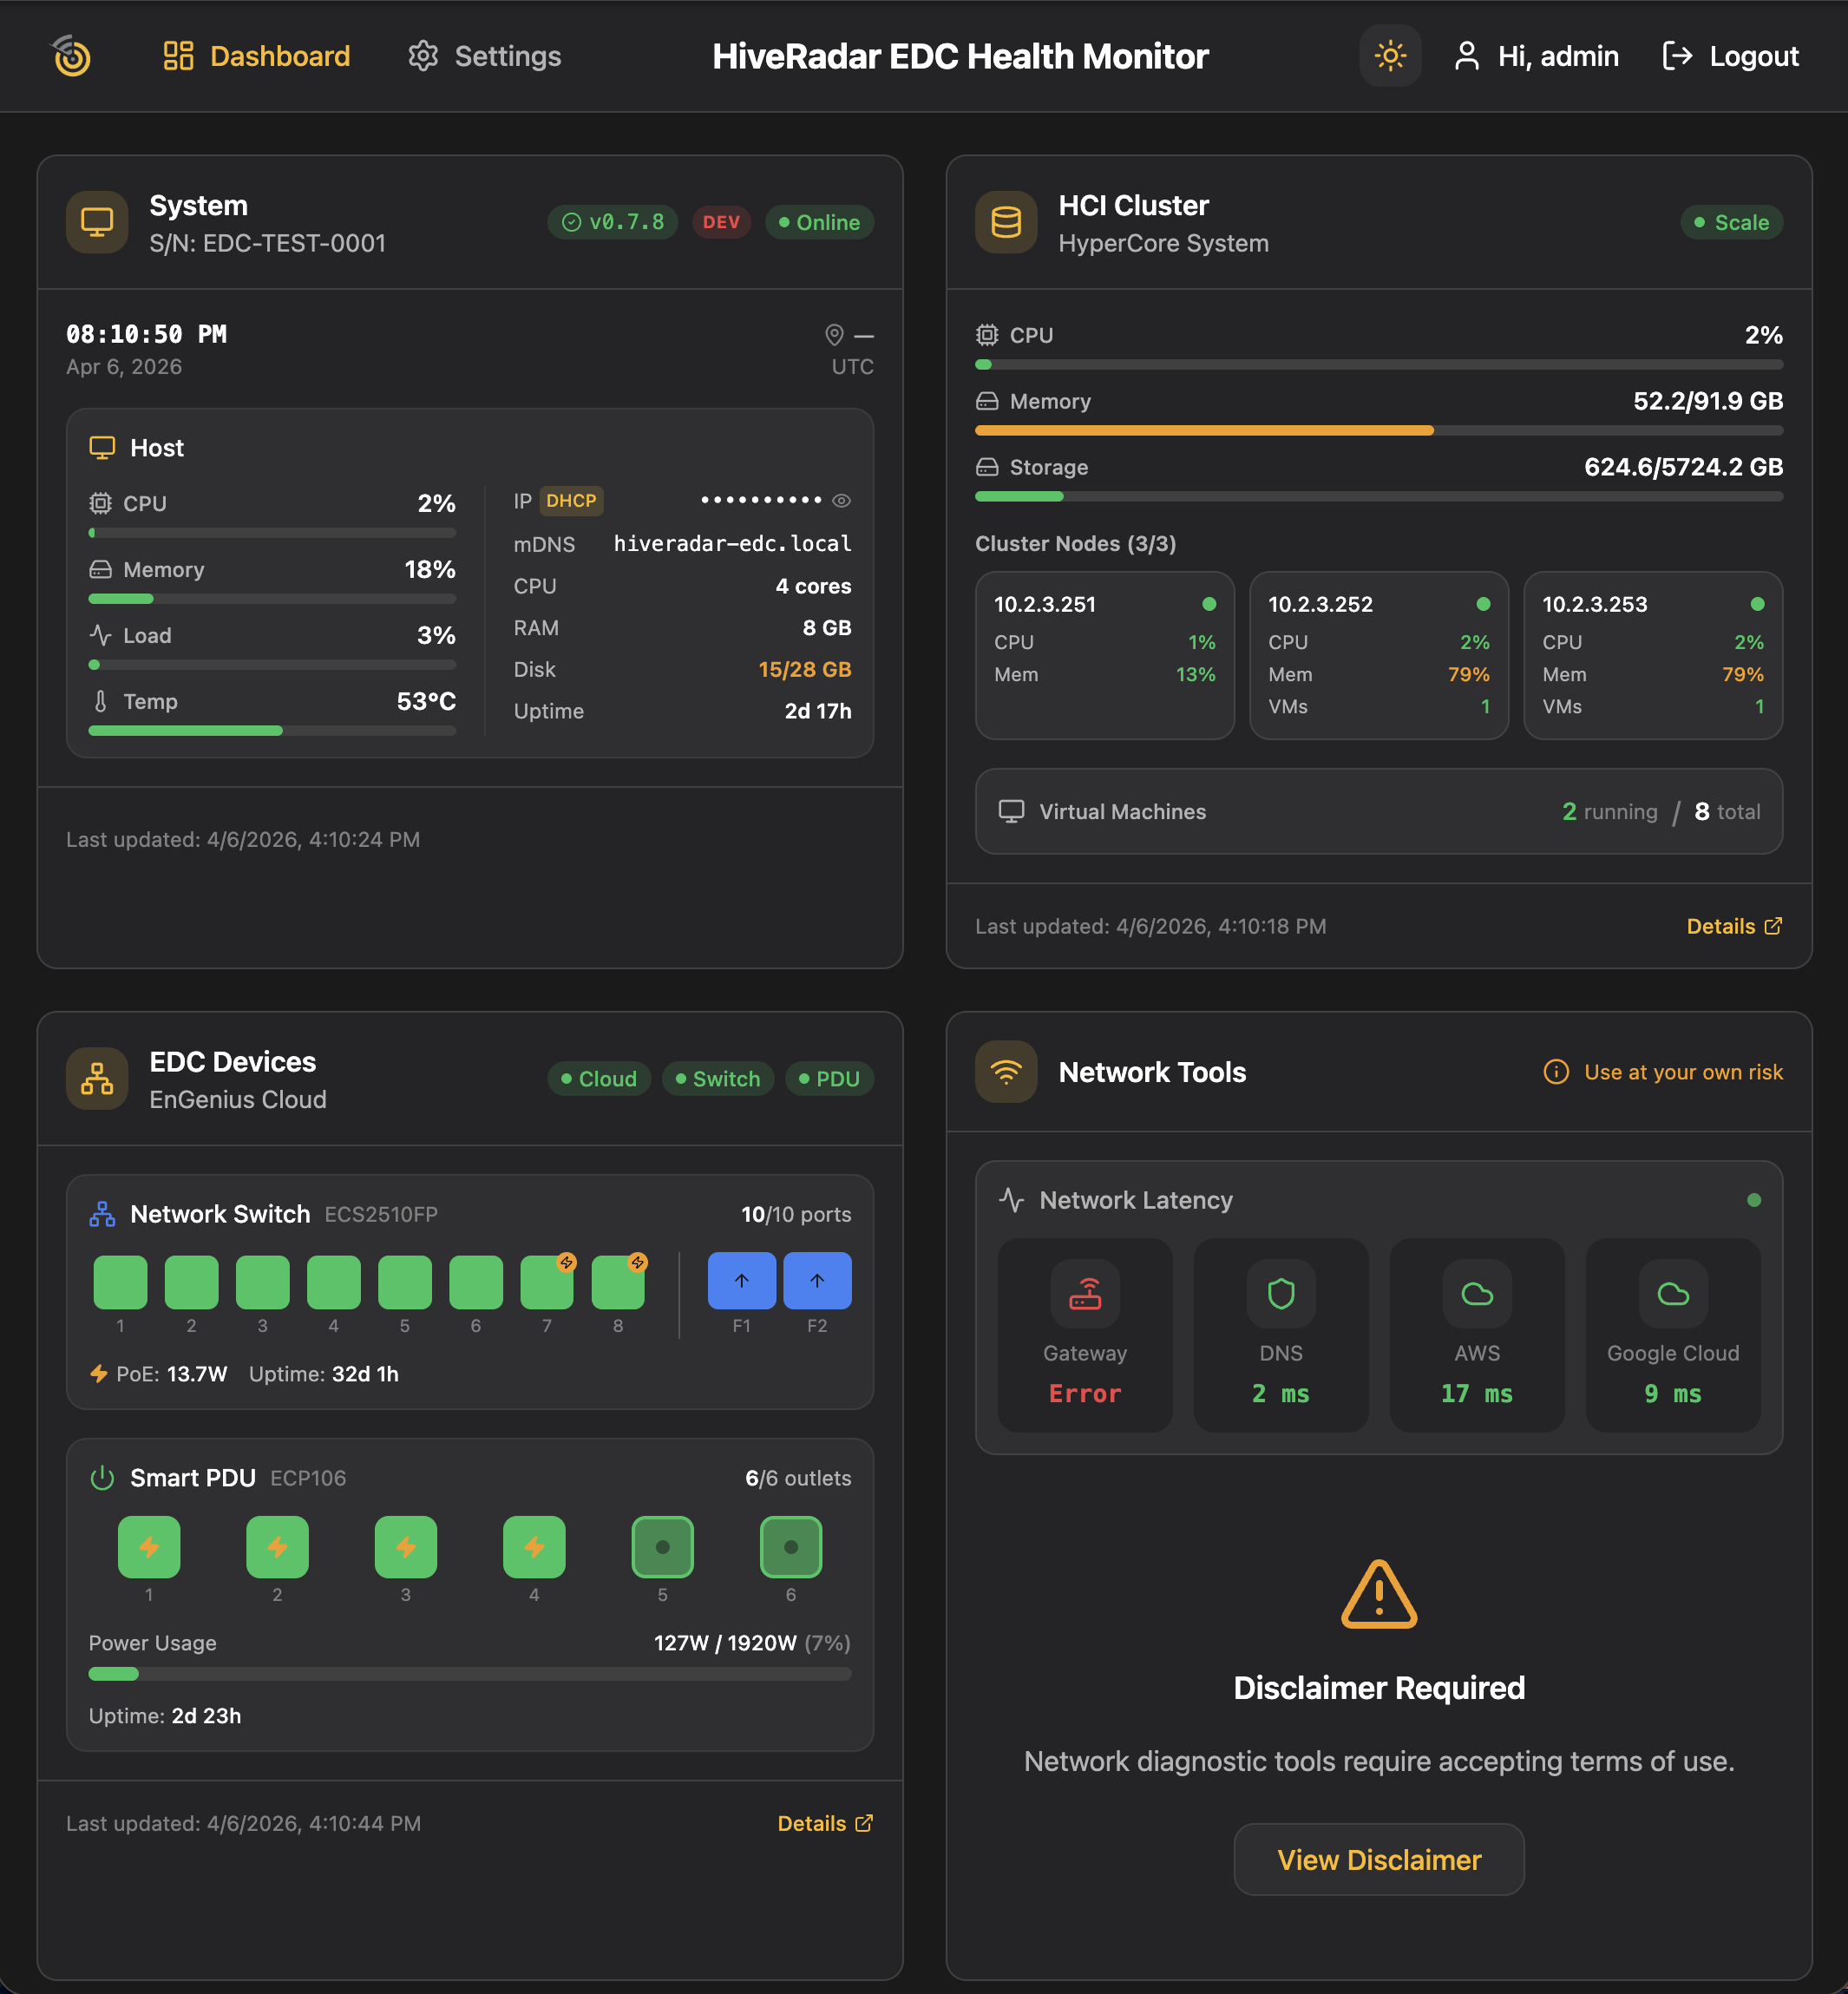
[Screenshot: Full dashboard — desktop view]
System Status Card
The System Status card shows real-time metrics for the EDC Health Monitor device itself (the SBC).
Metrics displayed:
- Date & time — Current date and time in your configured timezone
- Location — Site location (if configured)
- Version — Current software version with an update status indicator
- Connection status — Whether the backend API is reachable
- CPU — Usage percentage and core count
- RAM — Total memory capacity
- Storage — Disk usage with color-coded status:
- Green: healthy usage (under 50%)
- Yellow: getting full (50% or above)
- Red: critically full (80% or above)
- Uptime — How long the system has been running (days, hours, minutes)
- Primary IP — The device's IP address with a DHCP or Static badge (click the eye icon to show/hide)
- mDNS hostname — The
.localhostname for network discovery
UPS summary (if a UPS is connected):
- Battery percentage and charging status
- Estimated runtime remaining
- Voltage and current metrics
HCI Cluster Card
The HCI Cluster card provides a summary of your hyperconverged infrastructure health. Click the card to navigate to the detailed HCI Cluster page.
What you'll see:
- Cluster name and vendor badge (Scale Computing, Proxmox, etc.)
- Connection status — Connected (green), Stale (yellow), or Unreachable (red)
- Alert count — Warning badge if there are cluster alerts
- Aggregate resource metrics with progress bars:
- CPU usage (percentage across all nodes)
- Memory (used / total GB)
- Storage (used / total GB)
- Node grid — Each node in the cluster shown as a small tile with:
- Status indicator (green = online, red = offline)
- CPU and memory usage percentages
- Temperature (when available)
- Running VM count
- VM summary — Running VMs out of total VMs
- Data age — How recently the data was refreshed (e.g., "45s ago")
If no cluster is configured, the card shows a prompt to configure one.
EDC Devices Card
The EDC Devices card shows the status of your EnGenius Cloud-managed network switch and smart PDU.
Status indicators at the top:
- Cloud API connection status
- Network Switch status
- Smart PDU status
Switch section:
- Port status grid — visual representation of each switch port
- Link speed indicators per port
- Port connection status
PDU section:
- Outlet status grid — visual representation of each outlet
- Power consumption display
- Outlet on/off status per outlet
Click the card to navigate to the detailed EDC Devices page. If no devices are configured, the card shows a prompt to configure them.
Network Tools Card
The Network Tools card provides a suite of network diagnostic utilities built into the EDC. See the Network Tools section below for detailed descriptions of each tool.
On first use, you'll be asked to accept a disclaimer before running any tools.
The card also includes an Idle Latency Monitor at the bottom, which continuously measures network latency to regional endpoints and displays color-coded status indicators.
HCI Cluster Detail Page
Navigate to the HCI Cluster detail page by clicking the HCI Cluster card on the dashboard, or by going to /hci in the URL.
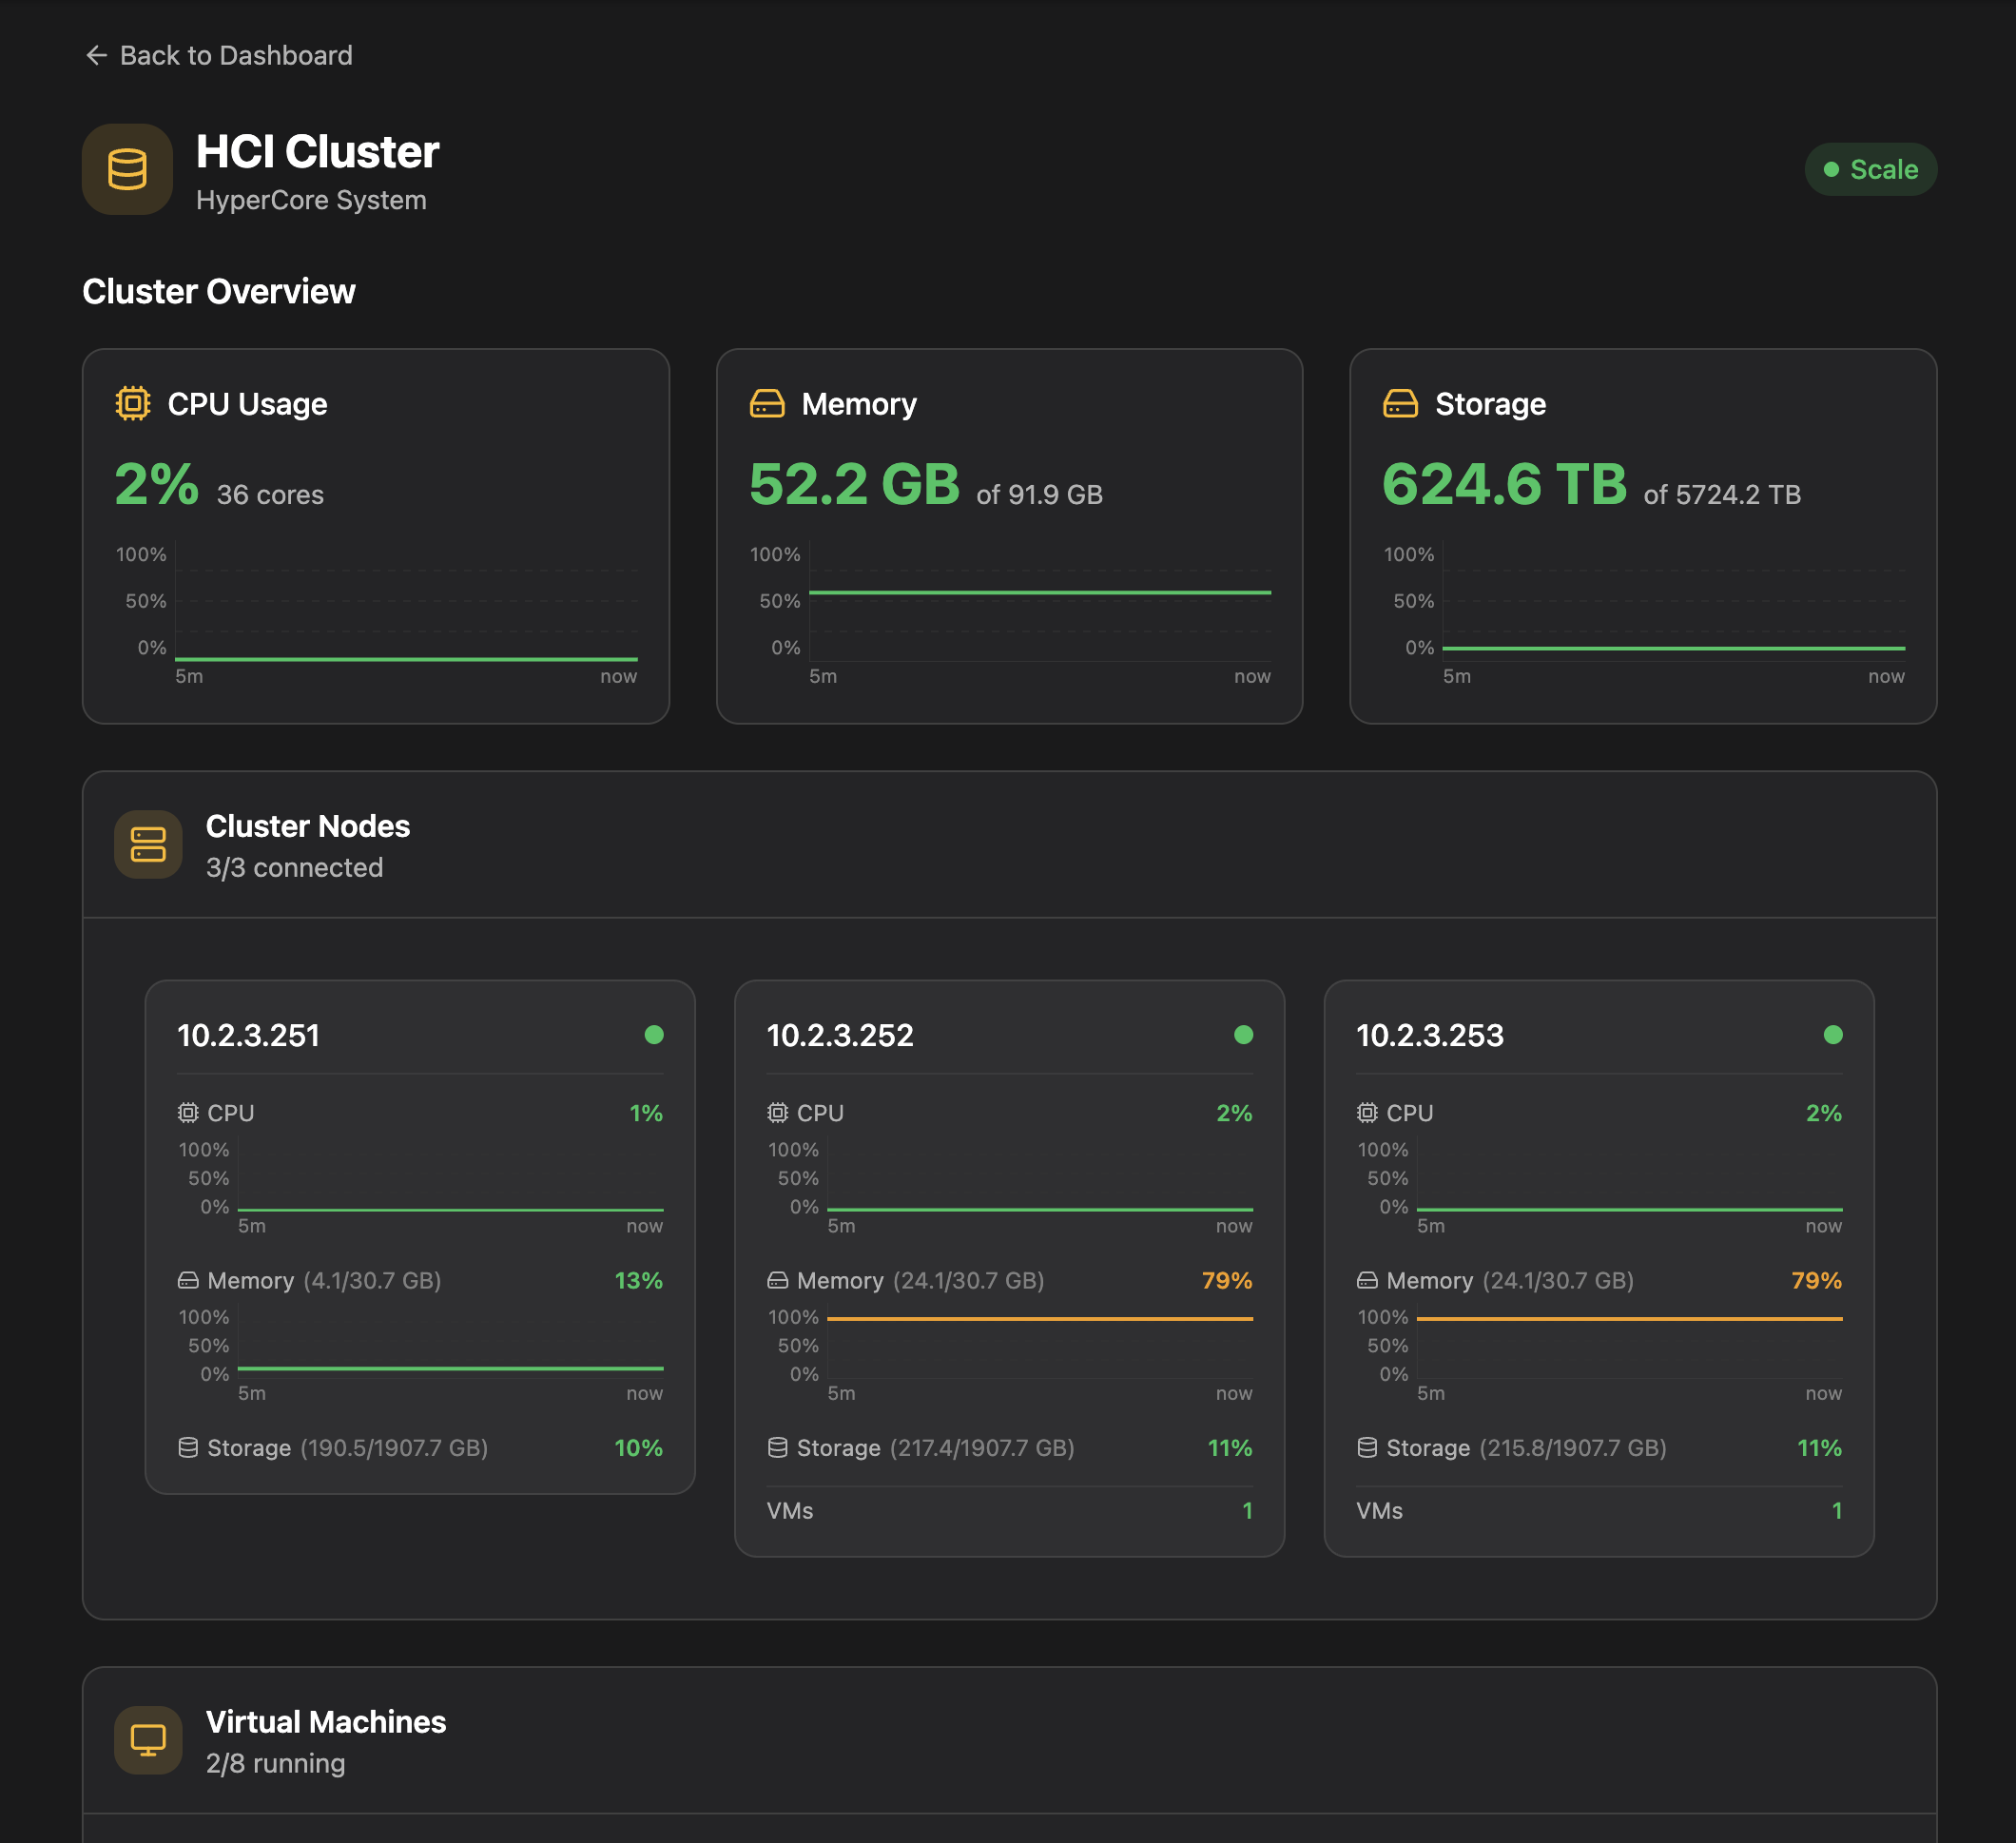
Cluster Overview
Three metric cards display cluster-wide resource utilization, each with a time-series trend chart:
| Metric | Shows |
|---|---|
| CPU Usage | Percentage utilization across all cores |
| Memory | Used GB out of total GB |
| Storage | Used TB out of total TB |
Each card includes a mini time-series chart showing the historical trend.
Cluster Nodes
The Cluster Nodes section displays each physical node in your cluster:
- Status indicator — Green (online), yellow (degraded), or red (offline)
- CPU usage — Per-node percentage with a sparkline chart
- Memory usage — Per-node percentage with a sparkline chart
- Temperature — Node temperature in degrees Celsius (when available)
- VM count — Number of running virtual machines on this node
The section header shows connected nodes out of total (e.g., "3/3 connected").
Virtual Machines
The Virtual Machines section lists all VMs across the cluster:
- Running VMs are shown with a green status indicator, grouped by the node they're running on
- Stopped VMs appear in an "Unassigned" section with red indicators
- Each entry shows the VM name, CPU usage, vCPU count, and RAM allocation
The section header shows running VMs out of total (e.g., "12/15 running").
Status Banners
When there are connectivity issues, banners appear at the top of the page:
- Cluster Unreachable (red) — The poller cannot reach the cluster. Shows how long since the last successful data retrieval.
- Connection Issue (yellow) — The connection is intermittent and data may be outdated.
[Screenshot: HCI Cluster detail page]
EDC Devices Detail Page
Navigate to the EDC Devices detail page by clicking the EDC Devices card on the dashboard, or by going to /devices in the URL.
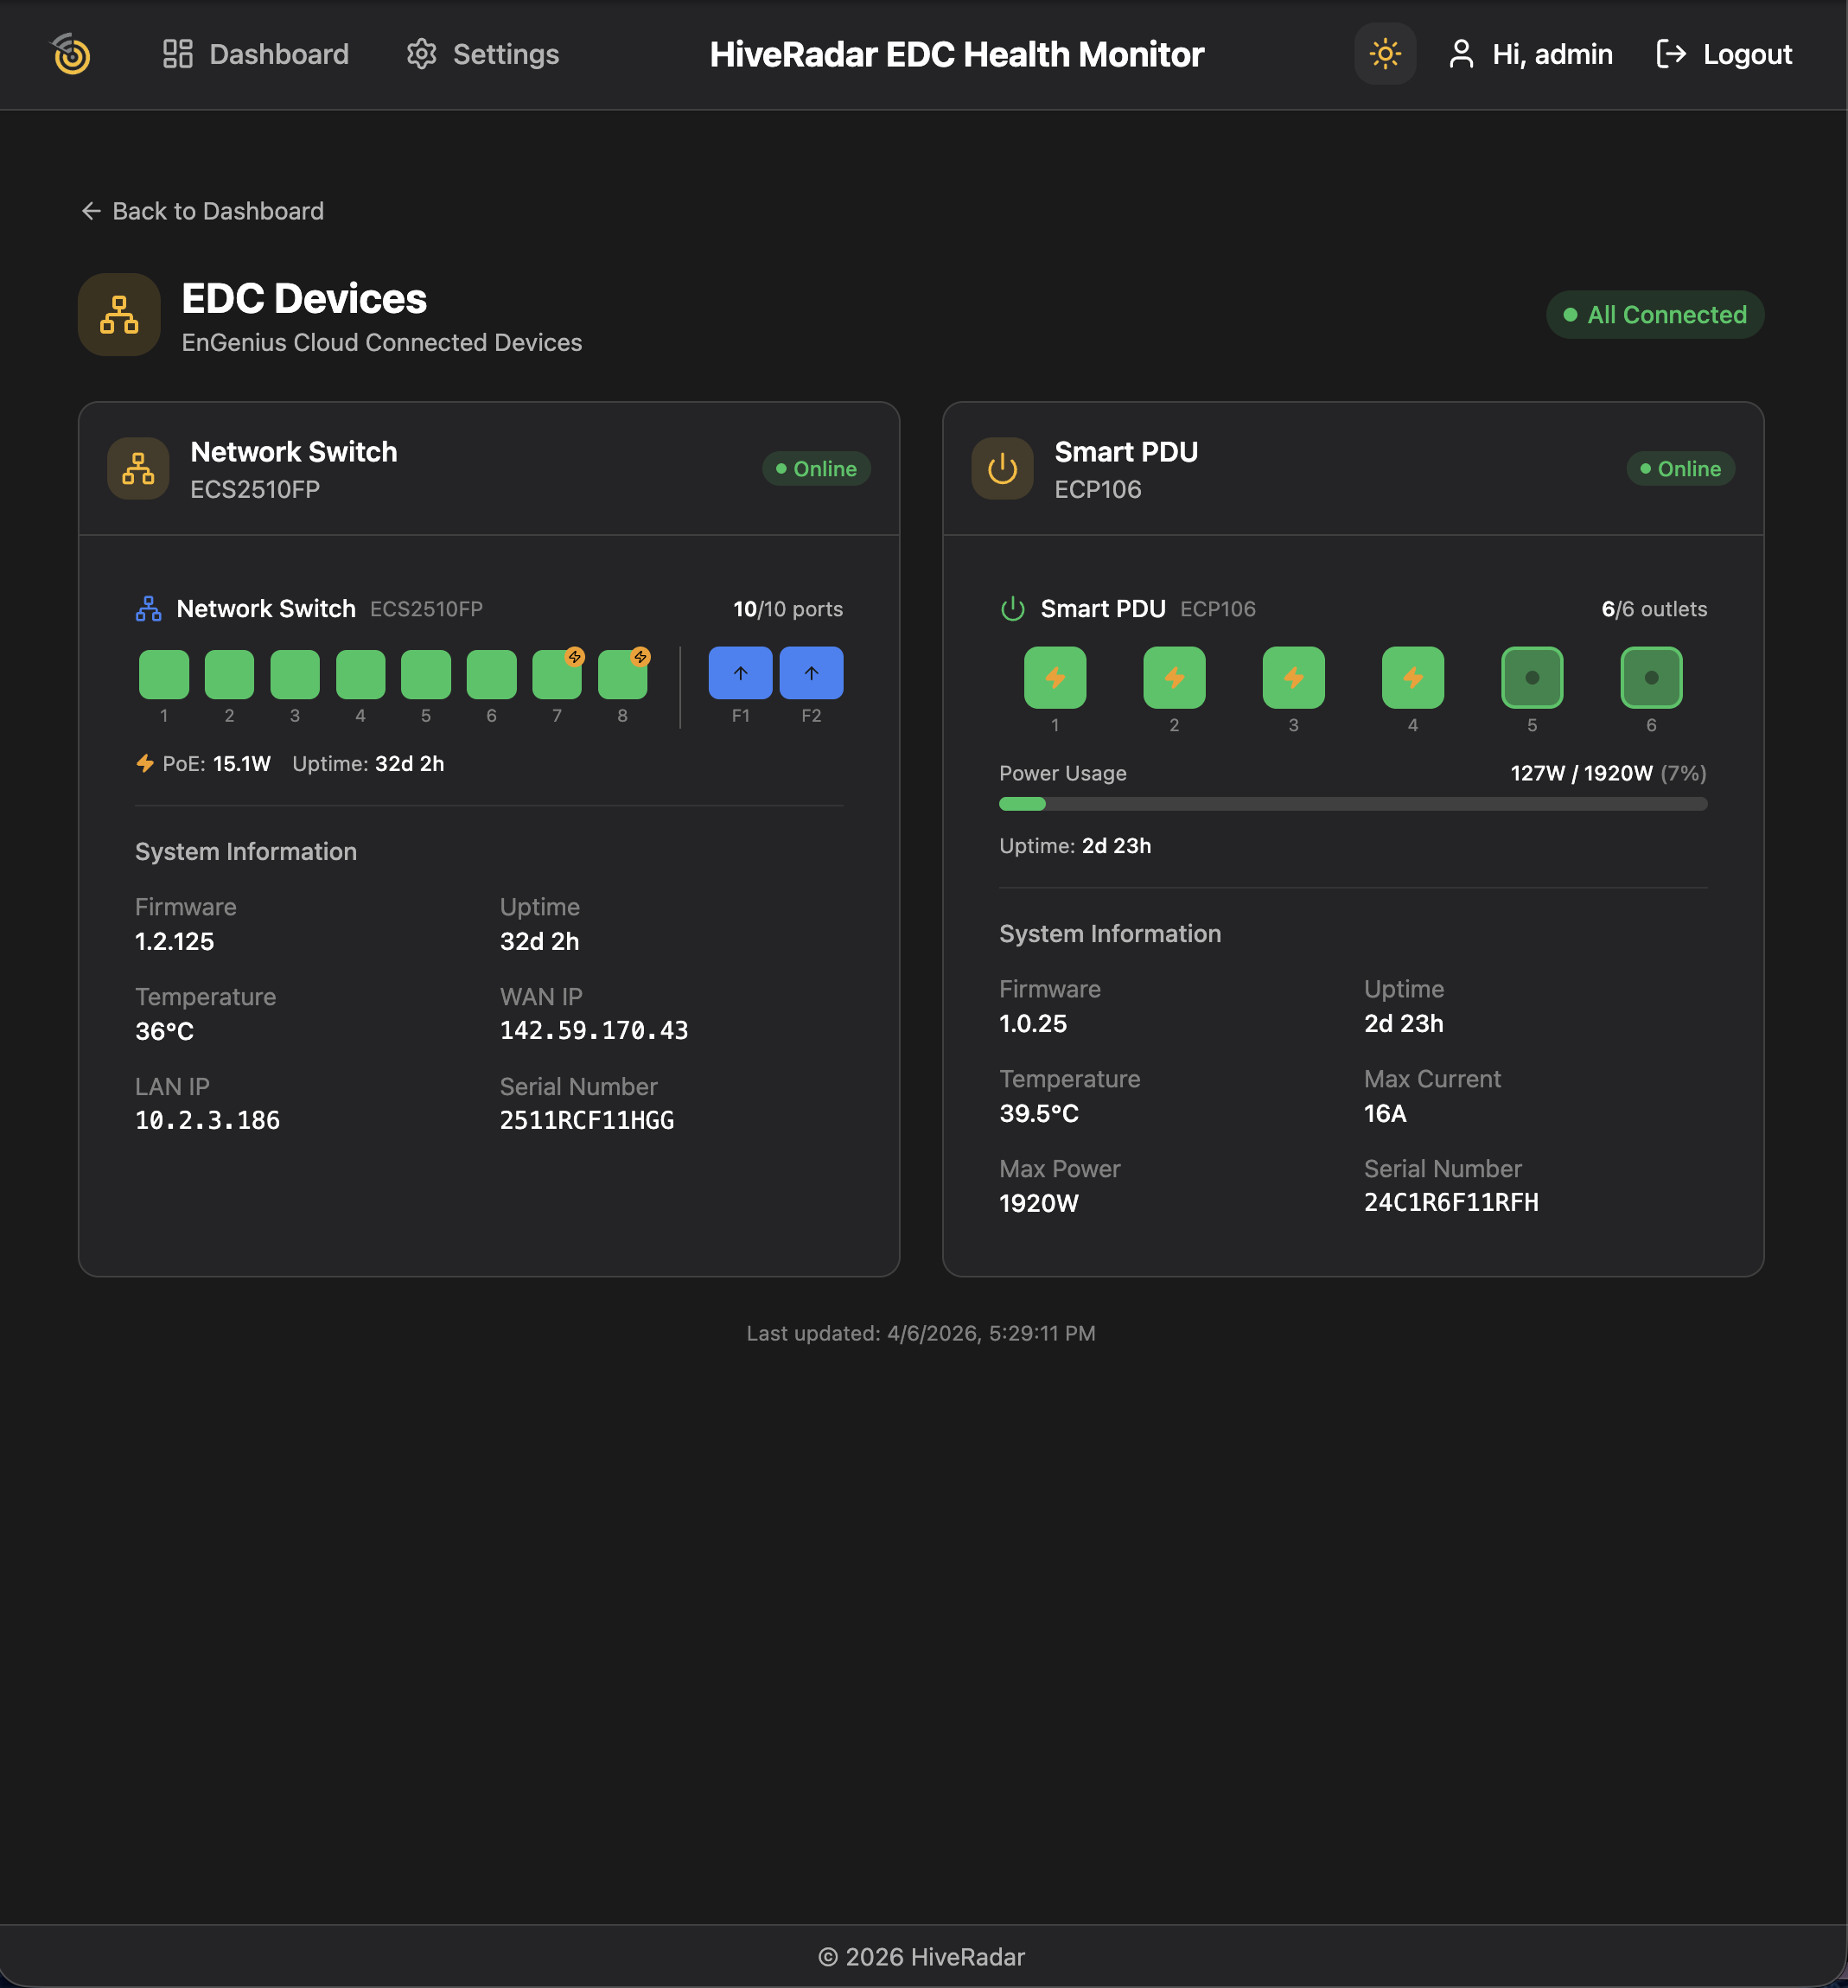
Network Switch
The switch section displays:
- Status badge — Online (green) or Offline (red)
- Port grid — Visual representation of each switch port and its connection status
- System information:
- Firmware version
- Uptime (days, hours, minutes)
- Temperature
- WAN IP and LAN IP addresses
- Serial number
Smart PDU
The PDU section displays:
- Status badge — Online (green) or Offline (red)
- Outlet grid — Visual representation of each outlet and its on/off status
- System information:
- Firmware version
- Uptime
- Temperature
- Max current (Amps) and max power (Watts)
- Serial number
[Screenshot: EDC Devices detail page]
UPS / Battery Monitoring
The EDC includes UPS (Uninterruptible Power Supply) monitoring via Network UPS Tools (NUT). The UPS is connected to the SBC via USB, and the NUT server communicates battery status to the dashboard.
Battery Card
The Battery card is displayed on the main dashboard (alongside the System Status card) when a UPS connection is configured.
Metrics displayed:
- Battery charge — A color-coded gauge showing the current charge percentage:
- Green: above 75%
- Orange: 25–75%
- Red: below 25%
- Battery voltage — Current battery voltage
- Estimated runtime — How long the system can run on battery (formatted as hours and minutes)
- Input / output voltage — Power input from mains and output to connected equipment
- Output load — Percentage of the UPS's capacity being used
- Temperature — UPS internal temperature
- Status — Current UPS state with color-coded indicator:
- OL (Online) — Running on mains power (green)
- OB (On Battery) — Running on battery power (orange)
- LB (Low Battery) — Battery is critically low (red)
- RB (Replace Battery) — Battery needs replacement (orange)
- CHRG (Charging) — Battery is charging (blue)
Connection indicators:
- Green dot: NUT service is accessible
- Red dot: NUT service is unreachable
- Separate indicator for the UPS device itself being online/offline
Detailed view: Click the expand/details button to see extended UPS information including battery type, UPS model, manufacturer, firmware version, serial number, and all raw NUT variables in a terminal-style viewer.
Network Tools
The Network Tools card provides a comprehensive suite of network diagnostic utilities that run directly from the EDC. Select a tool from the dropdown menu, configure any options, and click Run to execute.
On first use, you'll be asked to accept a disclaimer acknowledging that some tools (like network scanning) should only be used on networks you're authorized to test.
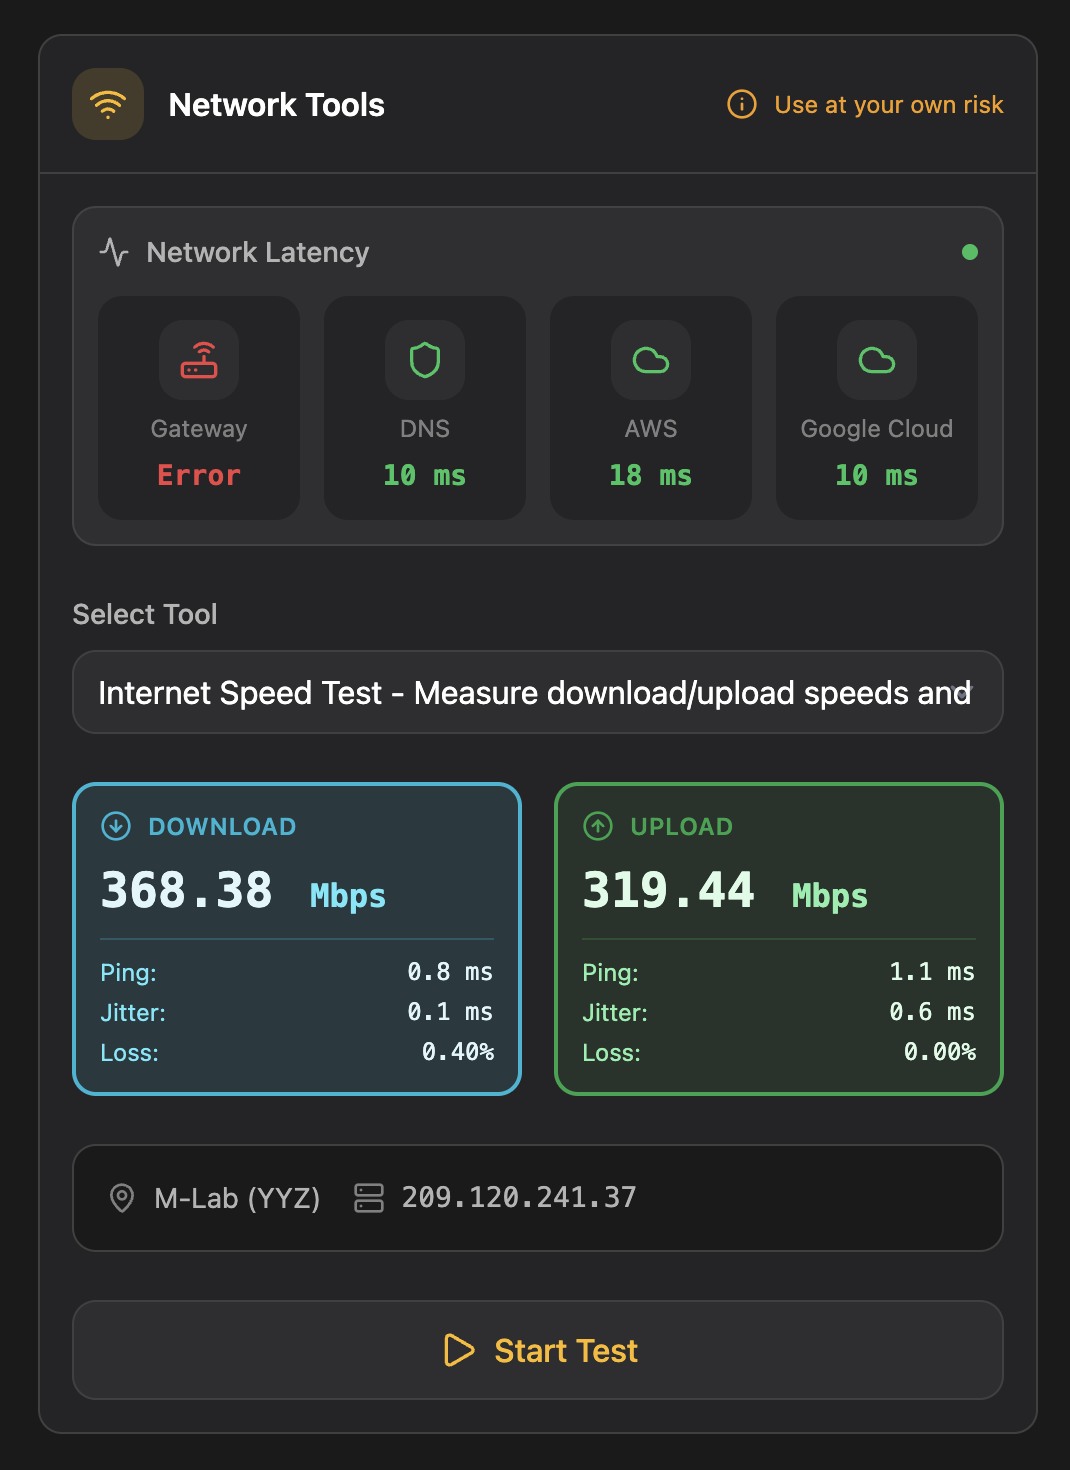
Internet Speed Test
Measures your internet connection speed from the EDC's location.
- Download speed — Measured in Mbps with an animated gauge
- Upload speed — Measured in Mbps with an animated gauge
- Ping — Latency to the speed test server (ms)
- Jitter — Variation in ping times (ms)
- Packet retransmission — Percentage of retransmitted packets
- Server info — Speed test server location and IP
The test runs in two phases (download then upload) with real-time progress display.
[Screenshot: Speed test results]
Enhanced Ping
Tests connectivity and measures latency to a specified target.
- Target — IP address or hostname (e.g.,
google.com) - Packet Count — Number of ping packets to send (1–10, default 4)
- Interval — Time between packets in seconds (0.2–5, default 1)
Network Scanner (nmap)
Discovers devices and scans ports on your local network.
- Target — IP address or CIDR range (e.g.,
192.168.1.0/24) - Scan Type:
- Ping Scan (Discovery Only) — finds active hosts
- Port Scan — checks for open ports on discovered hosts
- Ports — Comma-separated list of ports to scan (default:
22,80,443,3389,5432,3306)
Traceroute
Traces the network path from the EDC to a destination.
- Target — IP address or hostname
- Max Hops — Maximum number of hops to trace (1–30, default 30)
Shows hop-by-hop analysis with round-trip time (RTT) measurements for each hop.
DNS Lookup
Resolves domain names and queries DNS records.
- Target — Domain name or IP address
- Record Type — A (IPv4), AAAA (IPv6), MX (Mail), TXT, NS, or CNAME
- DNS Server — Optional specific DNS server to query (e.g.,
8.8.8.8)
ARP Table
Displays the local network's ARP (Address Resolution Protocol) table, showing the mapping between IP addresses and MAC addresses of devices on the local network. No configuration required — just run the tool.
Network Statistics (netstat)
Shows network connections and listening ports on the EDC itself.
- Type:
- Listening Ports — shows all ports the EDC is listening on
- Active Connections — shows current network connections
- Network Statistics — shows protocol-level statistics
MTR
Combines the functionality of ping and traceroute into a single diagnostic tool, providing ongoing statistics for each hop along the path.
- Target — IP address or hostname
- Report Cycles — Number of measurement cycles to run (1–20, default 10)
Idle Latency Monitor
Displayed at the bottom of the Network Tools card, this continuously monitors network latency to regional endpoints. Latency measurements are color-coded:
- Green — Low latency (good connection)
- Yellow — Moderate latency
- Red — High latency (potential network issue)
This runs automatically and does not require any configuration.
Settings
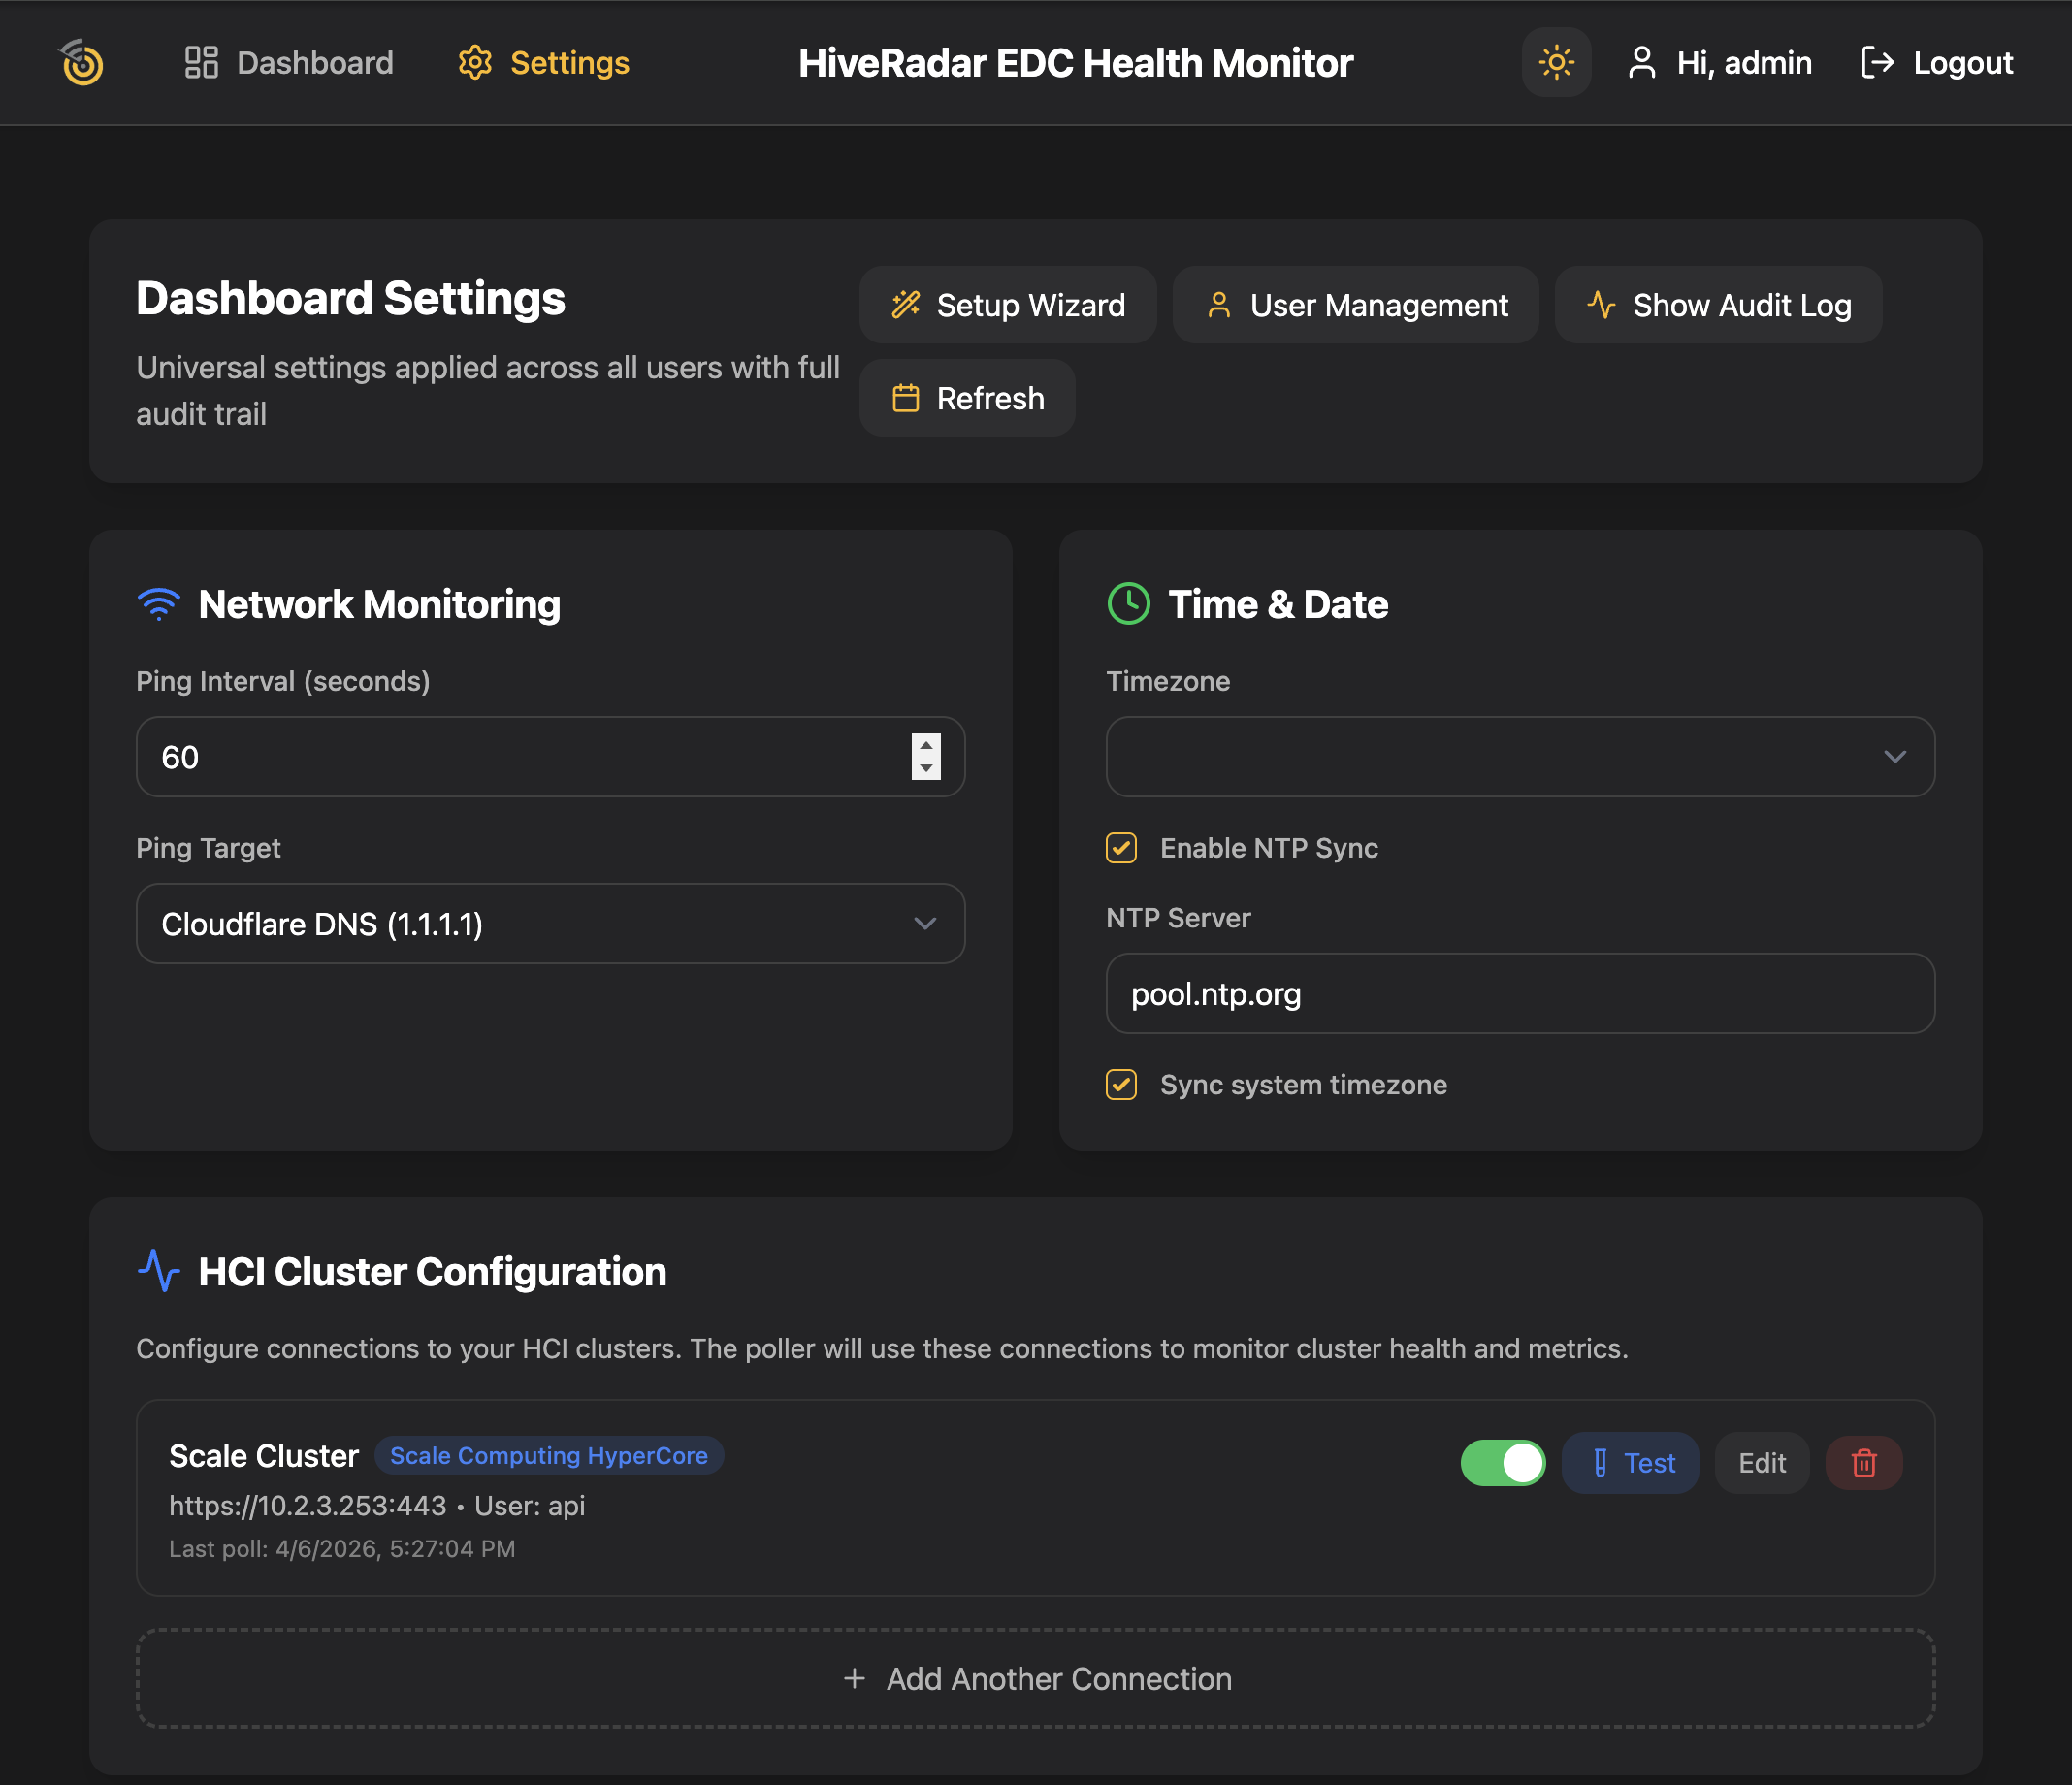
The Settings page (/settings) manages all dashboard configuration. Access it from the Settings link in the navigation bar.
The Settings header includes quick-action buttons:
- Setup Wizard (wand icon) — Re-run the initial setup wizard
- User Management — Navigate to user administration
- Show/Hide Audit Log — Toggle the audit log panel
- Refresh — Reload all settings from the server
[Screenshot: Settings page overview]
Network Monitoring
Configure how the dashboard monitors network connectivity:
| Setting | Description | Default |
|---|---|---|
| Ping Interval | How often to ping the target (seconds) | 60 |
| Ping Target | DNS server to use for connectivity checks | Cloudflare (1.1.1.1) |
Available ping targets: Cloudflare DNS (1.1.1.1), Google DNS (8.8.8.8), Quad9 DNS (9.9.9.9), OpenDNS (208.67.222.222), Verisign DNS (64.6.64.6).
Time & Date Settings
| Setting | Description | Default |
|---|---|---|
| Timezone | Your local timezone (IANA format) | Browser timezone |
| Enable NTP Sync | Synchronize time via NTP | Off |
| NTP Server | NTP server address (shown when NTP is enabled) | pool.ntp.org |
| Sync system timezone | Apply timezone setting to the host system | Off |
HCI Cluster Settings
Manage connections to your HCI clusters. Each connection has the following fields:
| Field | Description |
|---|---|
| Connection Name | Friendly name for this cluster |
| HCI Vendor | Scale Computing HyperCore or Proxmox VE |
| IP Address / Hostname | Cluster management IP or hostname |
| Port | Management port (443 for Scale, 8006 for Proxmox by default) |
| Protocol | HTTPS (recommended) or HTTP |
| Username | Cluster admin username |
| Password | Cluster admin password |
| Verify SSL | Whether to verify the cluster's SSL certificate |
| Enabled | Toggle polling on/off |
Adding a connection:
- Click Add Connection (or Add Another Connection if connections already exist)
- Fill in the connection details
- Click Test to verify connectivity
- Click Create Connection to save
Editing a connection: Click the Edit button on an existing connection, modify the fields, and click Update Connection.
Deleting a connection: Click the delete button (trash icon) and confirm.
Toggling polling: Use the toggle switch on each connection to enable or disable data collection without deleting the connection.
EnGenius Device Settings
Manage connections to your EnGenius Cloud-managed devices. Each connection has the following fields:
| Field | Description |
|---|---|
| Device Name | Friendly name for this device |
| Device Type | Switch or PDU |
| Serial Number | Device serial number from EnGenius Cloud |
| API Key | Your EnGenius Cloud API key |
| Organization ID | EnGenius Cloud organization ID |
| HV ID | EnGenius Cloud HV ID |
| Network ID | EnGenius Cloud network ID (optional) |
Adding a connection:
- Click Add Connection
- Enter the device name, type, serial number, and API key
- Click Auto-Discover Organization Details to automatically populate the Organization ID and HV ID
- Click Test to verify connectivity
- Click Create Connection to save
Editing, deleting, and toggling work the same as HCI connections.
System Updates
Monitor and apply software updates to the EDC Health Monitor.
- Current Stack Version — The currently installed version
- Last Checked — When updates were last checked
- Services list — Shows each service with its current version and whether an update is available
To check for and apply updates:
- Click Check for Updates to check for new versions
- If updates are available, each service with an update shows the new version number
- Click Apply Updates to install (admin only)
The system will restart during the update and may be unavailable for up to 15 minutes. Only administrators can apply updates.
Audit Log
Toggle the audit log with the Show Audit Log / Hide Audit Log button in the Settings header. The log shows a chronological record of all settings changes:
- Action type — Color-coded badge: create (green), update (blue), delete (red)
- Setting key — What was changed
- Timestamp — When the change was made
- Username — Who made the change
- IP Address — Where the change came from
- Previous and new values — Side-by-side comparison of what changed
The log displays the 50 most recent entries.
User Management
The User Management page (/settings/users) is accessible to administrators only.
User Statistics
Summary cards at the top show:
- Total Users — Total account count
- Active — Currently active accounts
- Admins — Accounts with administrator role
- Recent — Recently created accounts
User List
A table lists all users with:
- Username and email
- Role (Admin or User)
- Active status
- Last login time
- Account creation date
Creating a User
- Click Add User in the page header
- Fill in the required fields:
- Username (required) — 3–31 characters, letters and numbers only
- Email (optional)
- Password (required) — Minimum 6 characters
- Role — User or Administrator
- Click Create User
New users will be prompted to change their password on first login.
Editing a User
- Click the Edit button on a user row
- Modify any fields:
- Username, email, role
- Active User checkbox — Deactivate to prevent login without deleting the account
- Reset Password — Enter a new password (leave empty to keep the current one)
- Click Update User
You cannot edit your own account from this page. Use the password change feature from the navigation menu instead.
Deleting a User
- Click the delete button (trash icon) on a user row
- Confirm the deletion in the dialog
Restrictions:
- You cannot delete your own account
- You cannot delete the last administrator account
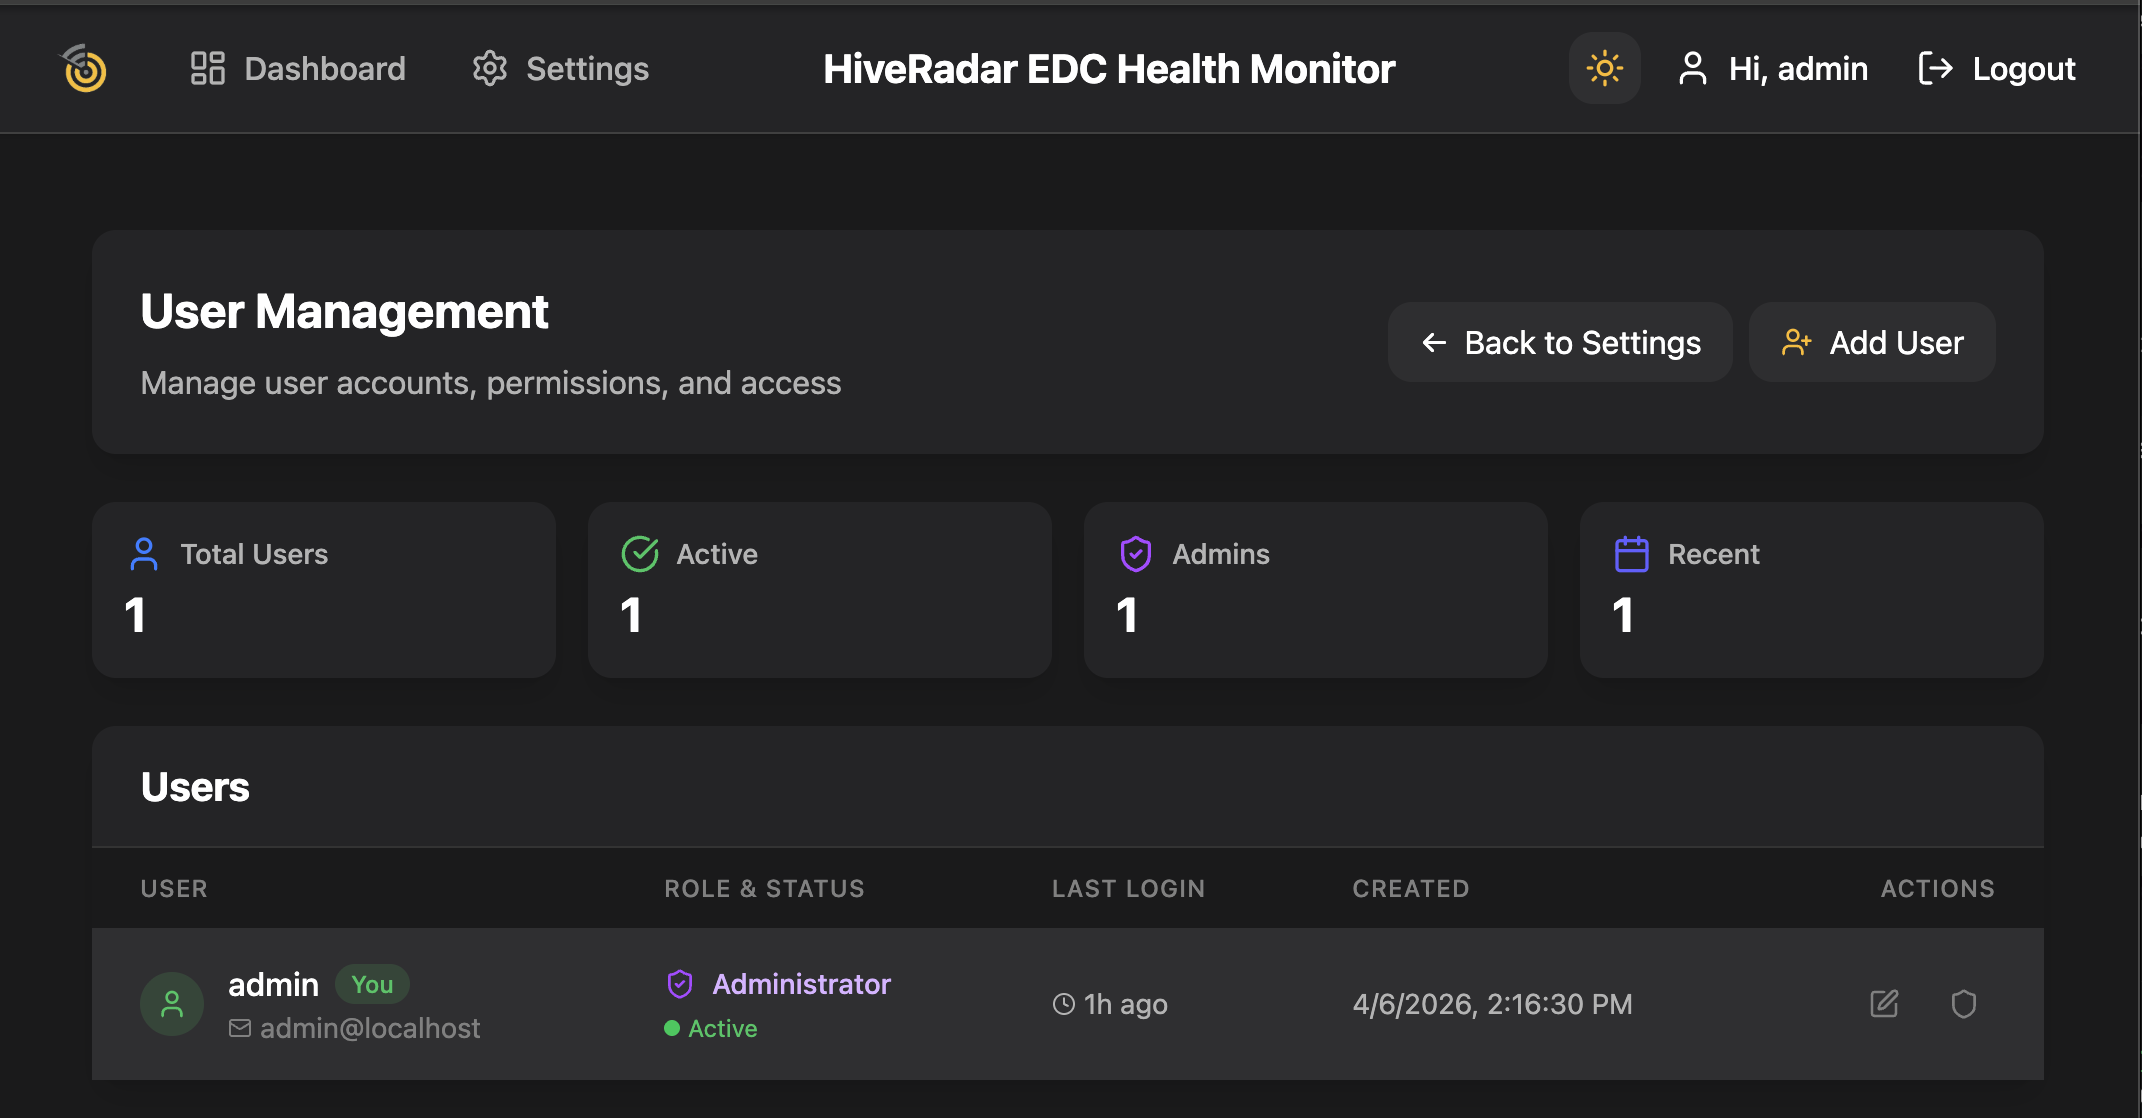
[Screenshot: User Management page]
StorMagic SvHCI Witness
On EDC deployments that include the StorMagic SKU (edc-sm), a StorMagic SvHCI Witness service runs alongside the monitoring dashboard. This service is critical for StorMagic SvHCI cluster operation.
What It Does
The witness service acts as a quorum witness for StorMagic SvHCI 2-node clusters. In a 2-node cluster, if one node fails or a network partition occurs (split-brain), the witness provides the tie-breaking vote to determine which node should continue operating. This prevents data corruption and ensures cluster availability.
How It's Deployed
- The witness runs as a separate container on the EDC's SBC
- It uses the host network directly (required for multicast cluster heartbeat)
- It starts automatically and requires no user configuration
- It is only present on StorMagic-edition EDCs — standard deployments do not include it
Verifying It's Running
The witness runs as a background service and requires no interaction. It starts automatically when the EDC powers on and will restart itself if interrupted.
Roles and Permissions
The dashboard has two user roles:
| Feature | User | Admin |
|---|---|---|
| View dashboard and all monitoring pages | Yes | Yes |
| Run network tools | Yes | Yes |
| View settings | Yes | Yes |
| Modify settings | No | Yes |
| Apply system updates | No | Yes |
| Manage users (create, edit, delete) | No | Yes |
| Change own password | Yes | Yes |
Quick Reference
| Item | Value |
|---|---|
| Default URL | https://<edc-ip> or https://hiveradar-edc.local |
| Default credentials | admin / admin |
| Login | /login |
| Dashboard | /dash |
| HCI Cluster details | /hci |
| EDC Devices details | /devices |
| Settings | /settings |
| User Management | /settings/users |
| Setup Wizard | /setup |